Immigrants from Scotland vs Immigrants from Ireland Unemployment Among Seniors over 65 years
COMPARE
Immigrants from Scotland
Immigrants from Ireland
Unemployment Among Seniors over 65 years
Unemployment Among Seniors over 65 years Comparison
Immigrants from Scotland
Immigrants from Ireland
5.0%
UNEMPLOYMENT AMONG SENIORS OVER 65 YEARS
95.0/ 100
METRIC RATING
104th/ 347
METRIC RANK
5.1%
UNEMPLOYMENT AMONG SENIORS OVER 65 YEARS
53.2/ 100
METRIC RATING
172nd/ 347
METRIC RANK
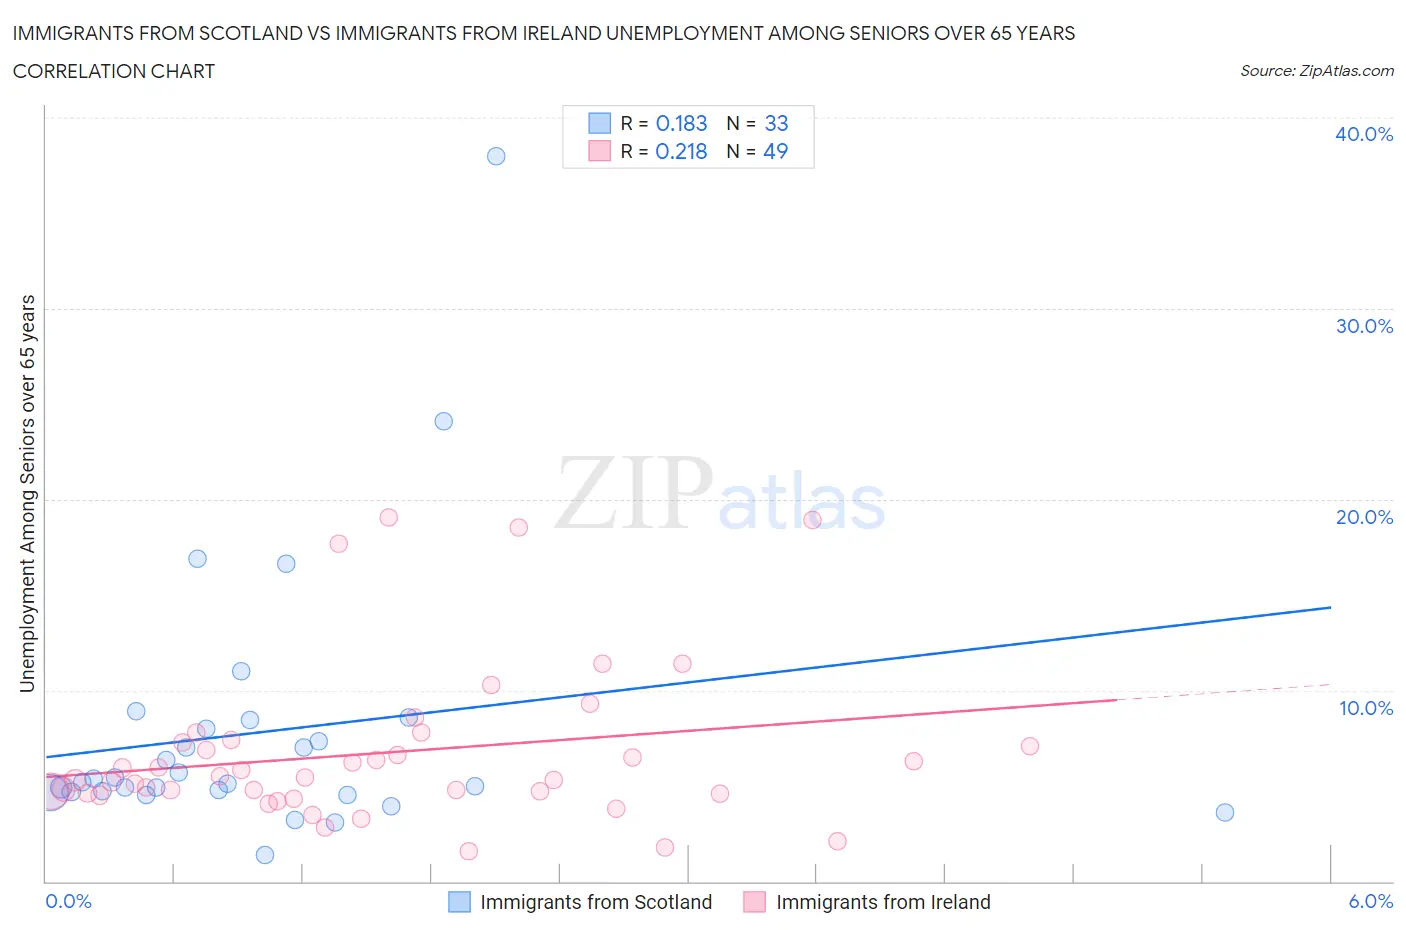
Immigrants from Scotland vs Immigrants from Ireland Unemployment Among Seniors over 65 years Correlation Chart
The statistical analysis conducted on geographies consisting of 185,987,813 people shows a poor positive correlation between the proportion of Immigrants from Scotland and unemployment rate amomg seniors over the age of 65 in the United States with a correlation coefficient (R) of 0.183 and weighted average of 5.0%. Similarly, the statistical analysis conducted on geographies consisting of 227,738,049 people shows a weak positive correlation between the proportion of Immigrants from Ireland and unemployment rate amomg seniors over the age of 65 in the United States with a correlation coefficient (R) of 0.218 and weighted average of 5.1%, a difference of 2.3%.
Unemployment Among Seniors over 65 years Correlation Summary
| Measurement | Immigrants from Scotland | Immigrants from Ireland |
| Minimum | 1.4% | 1.6% |
| Maximum | 38.0% | 19.0% |
| Range | 36.6% | 17.4% |
| Mean | 7.8% | 6.7% |
| Median | 5.2% | 5.4% |
| Interquartile 25% (IQ1) | 4.7% | 4.6% |
| Interquartile 75% (IQ3) | 8.2% | 7.3% |
| Interquartile Range (IQR) | 3.5% | 2.7% |
| Standard Deviation (Sample) | 7.1% | 4.1% |
| Standard Deviation (Population) | 6.9% | 4.1% |
Similar Demographics by Unemployment Among Seniors over 65 years
Demographics Similar to Immigrants from Scotland by Unemployment Among Seniors over 65 years
In terms of unemployment among seniors over 65 years, the demographic groups most similar to Immigrants from Scotland are Immigrants from Lithuania (5.0%, a difference of 0.020%), Okinawan (5.0%, a difference of 0.050%), Immigrants from Thailand (5.0%, a difference of 0.070%), Yugoslavian (5.0%, a difference of 0.080%), and Romanian (5.0%, a difference of 0.10%).
| Demographics | Rating | Rank | Unemployment Among Seniors over 65 years |
| Immigrants | Oceania | 96.8 /100 | #97 | Exceptional 5.0% |
| Czechoslovakians | 96.7 /100 | #98 | Exceptional 5.0% |
| South Africans | 96.5 /100 | #99 | Exceptional 5.0% |
| Romanians | 95.5 /100 | #100 | Exceptional 5.0% |
| Yugoslavians | 95.4 /100 | #101 | Exceptional 5.0% |
| Immigrants | Thailand | 95.4 /100 | #102 | Exceptional 5.0% |
| Immigrants | Lithuania | 95.1 /100 | #103 | Exceptional 5.0% |
| Immigrants | Scotland | 95.0 /100 | #104 | Exceptional 5.0% |
| Okinawans | 94.7 /100 | #105 | Exceptional 5.0% |
| Immigrants | Turkey | 94.3 /100 | #106 | Exceptional 5.0% |
| Immigrants | Germany | 93.2 /100 | #107 | Exceptional 5.0% |
| Immigrants | Vietnam | 92.9 /100 | #108 | Exceptional 5.0% |
| Immigrants | Malaysia | 92.7 /100 | #109 | Exceptional 5.0% |
| Immigrants | Saudi Arabia | 92.7 /100 | #110 | Exceptional 5.0% |
| Finns | 92.2 /100 | #111 | Exceptional 5.0% |
Demographics Similar to Immigrants from Ireland by Unemployment Among Seniors over 65 years
In terms of unemployment among seniors over 65 years, the demographic groups most similar to Immigrants from Ireland are Nonimmigrants (5.1%, a difference of 0.030%), Immigrants from Spain (5.1%, a difference of 0.050%), Immigrants from Eastern Asia (5.1%, a difference of 0.060%), Spanish American (5.1%, a difference of 0.10%), and Immigrants from Eastern Europe (5.1%, a difference of 0.11%).
| Demographics | Rating | Rank | Unemployment Among Seniors over 65 years |
| Immigrants | Ukraine | 64.2 /100 | #165 | Good 5.1% |
| Immigrants | Laos | 63.8 /100 | #166 | Good 5.1% |
| Immigrants | Western Europe | 60.4 /100 | #167 | Good 5.1% |
| Mongolians | 59.8 /100 | #168 | Average 5.1% |
| Lithuanians | 58.2 /100 | #169 | Average 5.1% |
| Immigrants | Eastern Asia | 54.9 /100 | #170 | Average 5.1% |
| Immigrants | Nonimmigrants | 54.1 /100 | #171 | Average 5.1% |
| Immigrants | Ireland | 53.2 /100 | #172 | Average 5.1% |
| Immigrants | Spain | 51.7 /100 | #173 | Average 5.1% |
| Spanish Americans | 50.0 /100 | #174 | Average 5.1% |
| Immigrants | Eastern Europe | 49.8 /100 | #175 | Average 5.1% |
| Indians (Asian) | 46.6 /100 | #176 | Average 5.2% |
| Icelanders | 45.9 /100 | #177 | Average 5.2% |
| Immigrants | Belgium | 44.8 /100 | #178 | Average 5.2% |
| Immigrants | Somalia | 44.0 /100 | #179 | Average 5.2% |