Immigrants from Scotland vs Immigrants from Ireland Unemployment Among Ages 30 to 34 years
COMPARE
Immigrants from Scotland
Immigrants from Ireland
Unemployment Among Ages 30 to 34 years
Unemployment Among Ages 30 to 34 years Comparison
Immigrants from Scotland
Immigrants from Ireland
5.4%
UNEMPLOYMENT AMONG AGES 30 TO 34 YEARS
59.3/ 100
METRIC RATING
160th/ 347
METRIC RANK
5.2%
UNEMPLOYMENT AMONG AGES 30 TO 34 YEARS
90.6/ 100
METRIC RATING
99th/ 347
METRIC RANK
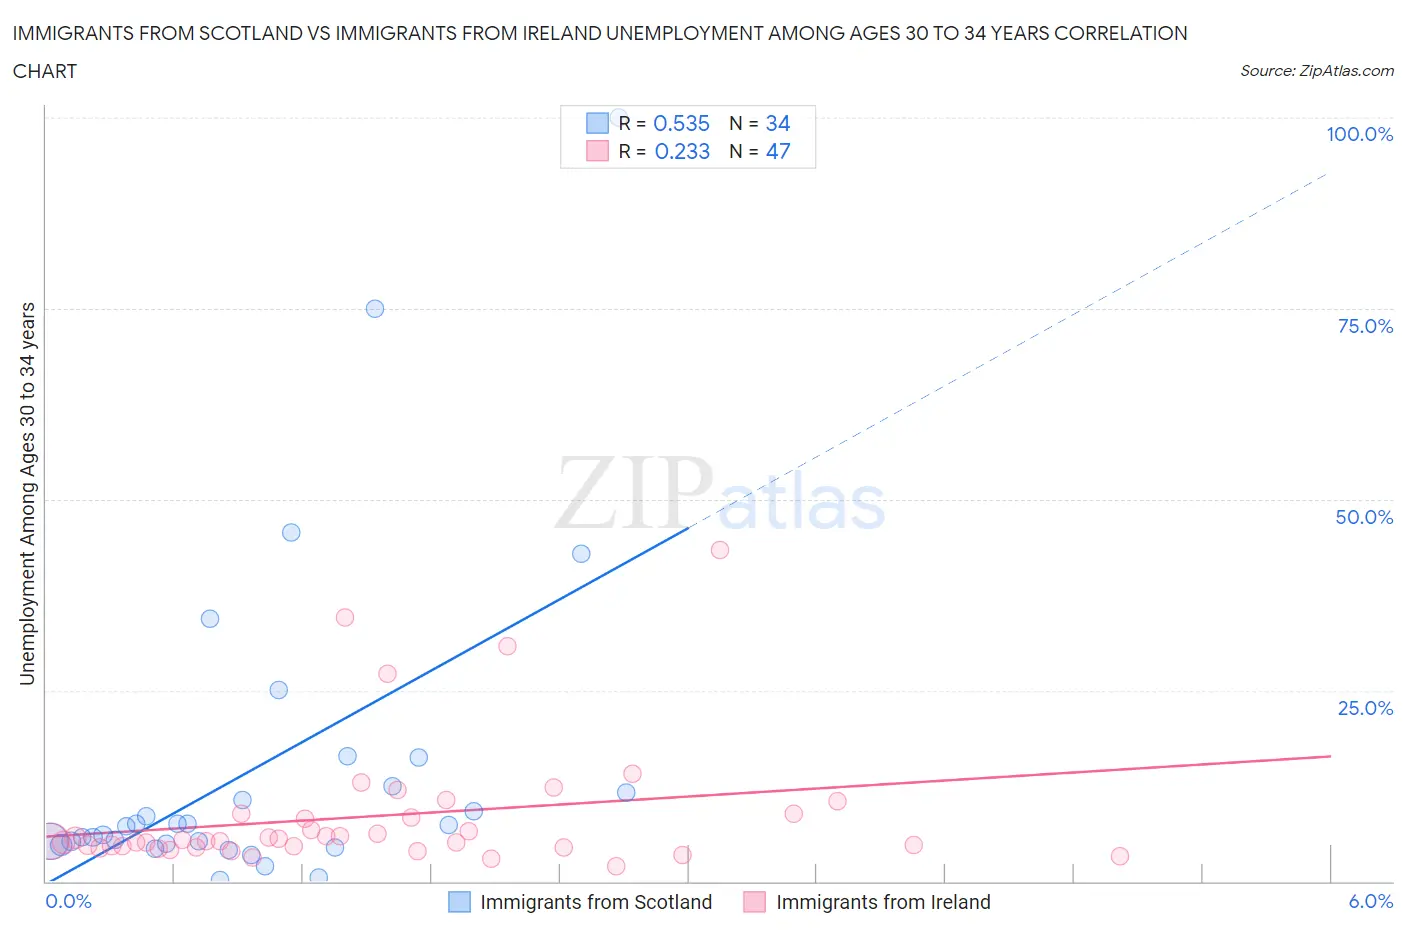
Immigrants from Scotland vs Immigrants from Ireland Unemployment Among Ages 30 to 34 years Correlation Chart
The statistical analysis conducted on geographies consisting of 188,822,725 people shows a substantial positive correlation between the proportion of Immigrants from Scotland and unemployment rate among population between the ages 30 and 34 in the United States with a correlation coefficient (R) of 0.535 and weighted average of 5.4%. Similarly, the statistical analysis conducted on geographies consisting of 230,437,728 people shows a weak positive correlation between the proportion of Immigrants from Ireland and unemployment rate among population between the ages 30 and 34 in the United States with a correlation coefficient (R) of 0.233 and weighted average of 5.2%, a difference of 3.4%.
Unemployment Among Ages 30 to 34 years Correlation Summary
| Measurement | Immigrants from Scotland | Immigrants from Ireland |
| Minimum | 0.20% | 2.0% |
| Maximum | 100.0% | 43.3% |
| Range | 99.8% | 41.3% |
| Mean | 15.1% | 8.5% |
| Median | 7.3% | 5.2% |
| Interquartile 25% (IQ1) | 4.8% | 4.5% |
| Interquartile 75% (IQ3) | 12.5% | 8.8% |
| Interquartile Range (IQR) | 7.7% | 4.3% |
| Standard Deviation (Sample) | 21.6% | 8.5% |
| Standard Deviation (Population) | 21.2% | 8.4% |
Similar Demographics by Unemployment Among Ages 30 to 34 years
Demographics Similar to Immigrants from Scotland by Unemployment Among Ages 30 to 34 years
In terms of unemployment among ages 30 to 34 years, the demographic groups most similar to Immigrants from Scotland are Austrian (5.4%, a difference of 0.020%), Brazilian (5.4%, a difference of 0.080%), Arab (5.4%, a difference of 0.12%), Immigrants from Croatia (5.4%, a difference of 0.13%), and Basque (5.4%, a difference of 0.14%).
| Demographics | Rating | Rank | Unemployment Among Ages 30 to 34 years |
| Immigrants | South Eastern Asia | 66.5 /100 | #153 | Good 5.4% |
| South Africans | 66.5 /100 | #154 | Good 5.4% |
| Immigrants | Hungary | 66.1 /100 | #155 | Good 5.4% |
| Czechoslovakians | 63.7 /100 | #156 | Good 5.4% |
| Albanians | 63.7 /100 | #157 | Good 5.4% |
| Immigrants | Belarus | 62.7 /100 | #158 | Good 5.4% |
| Immigrants | Croatia | 61.0 /100 | #159 | Good 5.4% |
| Immigrants | Scotland | 59.3 /100 | #160 | Average 5.4% |
| Austrians | 59.0 /100 | #161 | Average 5.4% |
| Brazilians | 58.2 /100 | #162 | Average 5.4% |
| Arabs | 57.7 /100 | #163 | Average 5.4% |
| Basques | 57.3 /100 | #164 | Average 5.4% |
| Welsh | 56.3 /100 | #165 | Average 5.4% |
| Immigrants | Thailand | 55.6 /100 | #166 | Average 5.4% |
| English | 54.8 /100 | #167 | Average 5.4% |
Demographics Similar to Immigrants from Ireland by Unemployment Among Ages 30 to 34 years
In terms of unemployment among ages 30 to 34 years, the demographic groups most similar to Immigrants from Ireland are Immigrants from North Macedonia (5.2%, a difference of 0.070%), Immigrants from Czechoslovakia (5.3%, a difference of 0.21%), Mongolian (5.2%, a difference of 0.25%), European (5.2%, a difference of 0.25%), and British (5.3%, a difference of 0.28%).
| Demographics | Rating | Rank | Unemployment Among Ages 30 to 34 years |
| Immigrants | Argentina | 92.5 /100 | #92 | Exceptional 5.2% |
| Laotians | 92.4 /100 | #93 | Exceptional 5.2% |
| Maltese | 92.3 /100 | #94 | Exceptional 5.2% |
| Kenyans | 92.1 /100 | #95 | Exceptional 5.2% |
| Mongolians | 91.7 /100 | #96 | Exceptional 5.2% |
| Europeans | 91.7 /100 | #97 | Exceptional 5.2% |
| Immigrants | North Macedonia | 90.9 /100 | #98 | Exceptional 5.2% |
| Immigrants | Ireland | 90.6 /100 | #99 | Exceptional 5.2% |
| Immigrants | Czechoslovakia | 89.5 /100 | #100 | Excellent 5.3% |
| British | 89.1 /100 | #101 | Excellent 5.3% |
| Immigrants | Switzerland | 88.8 /100 | #102 | Excellent 5.3% |
| Immigrants | Jordan | 88.8 /100 | #103 | Excellent 5.3% |
| Northern Europeans | 87.9 /100 | #104 | Excellent 5.3% |
| Argentineans | 87.9 /100 | #105 | Excellent 5.3% |
| Croatians | 87.6 /100 | #106 | Excellent 5.3% |