Immigrants from Scotland vs Bhutanese Disability
COMPARE
Immigrants from Scotland
Bhutanese
Disability
Disability Comparison
Immigrants from Scotland
Bhutanese
11.8%
DISABILITY
28.2/ 100
METRIC RATING
186th/ 347
METRIC RANK
11.2%
DISABILITY
97.4/ 100
METRIC RATING
97th/ 347
METRIC RANK
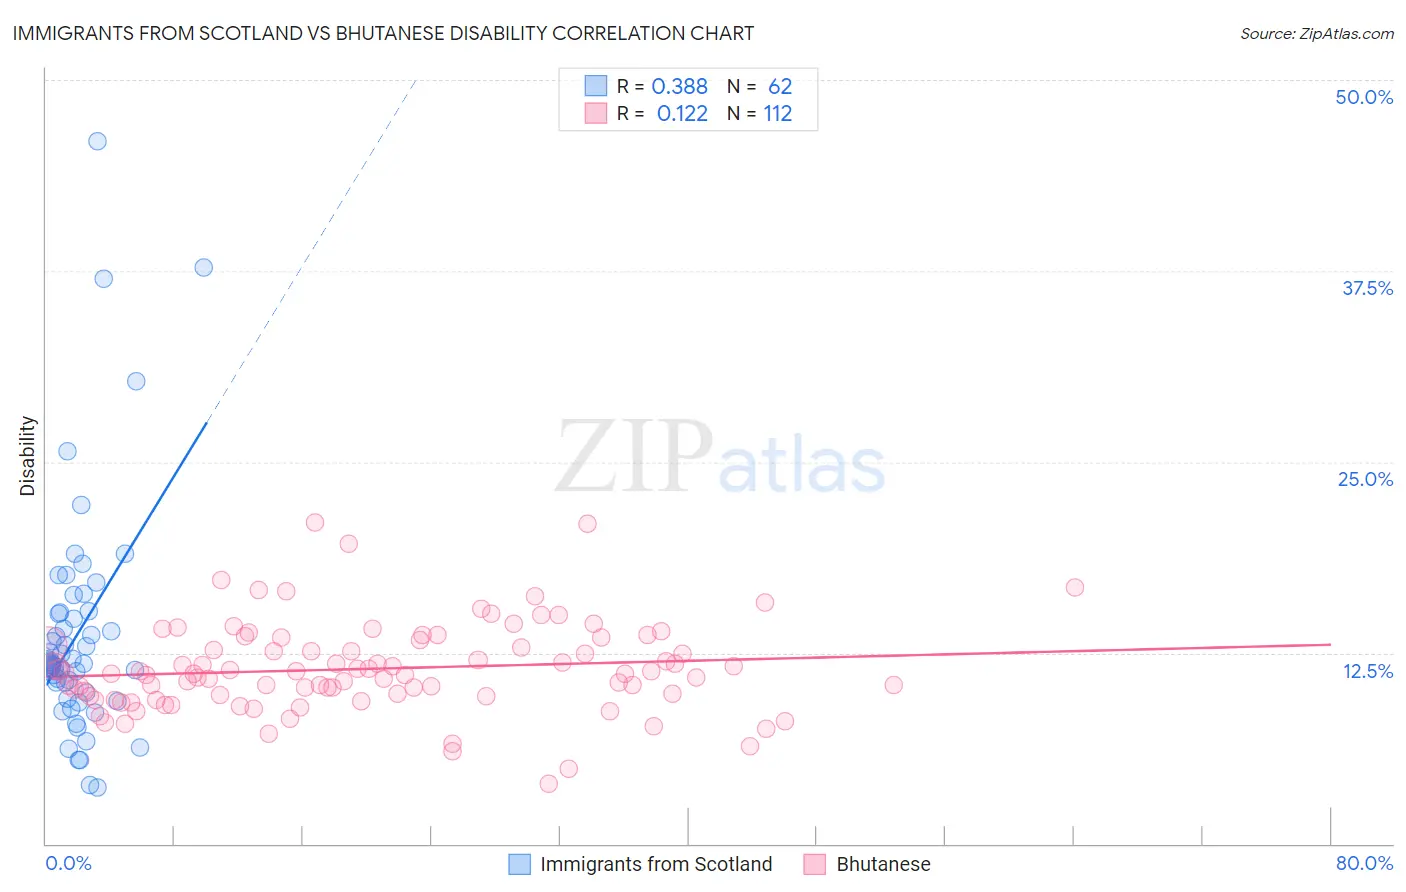
Immigrants from Scotland vs Bhutanese Disability Correlation Chart
The statistical analysis conducted on geographies consisting of 196,399,037 people shows a mild positive correlation between the proportion of Immigrants from Scotland and percentage of population with a disability in the United States with a correlation coefficient (R) of 0.388 and weighted average of 11.8%. Similarly, the statistical analysis conducted on geographies consisting of 455,521,093 people shows a poor positive correlation between the proportion of Bhutanese and percentage of population with a disability in the United States with a correlation coefficient (R) of 0.122 and weighted average of 11.2%, a difference of 5.2%.
Disability Correlation Summary
| Measurement | Immigrants from Scotland | Bhutanese |
| Minimum | 3.7% | 4.0% |
| Maximum | 46.0% | 21.0% |
| Range | 42.3% | 17.0% |
| Mean | 13.8% | 11.5% |
| Median | 11.8% | 11.2% |
| Interquartile 25% (IQ1) | 9.9% | 9.7% |
| Interquartile 75% (IQ3) | 15.1% | 13.2% |
| Interquartile Range (IQR) | 5.2% | 3.5% |
| Standard Deviation (Sample) | 7.7% | 2.9% |
| Standard Deviation (Population) | 7.6% | 2.9% |
Similar Demographics by Disability
Demographics Similar to Immigrants from Scotland by Disability
In terms of disability, the demographic groups most similar to Immigrants from Scotland are Immigrants from Burma/Myanmar (11.8%, a difference of 0.010%), Lebanese (11.8%, a difference of 0.020%), Iraqi (11.8%, a difference of 0.090%), Honduran (11.8%, a difference of 0.16%), and Immigrants from Mexico (11.9%, a difference of 0.26%).
| Demographics | Rating | Rank | Disability |
| Immigrants | Armenia | 41.9 /100 | #179 | Average 11.7% |
| Immigrants | Honduras | 37.8 /100 | #180 | Fair 11.8% |
| Immigrants | Oceania | 34.3 /100 | #181 | Fair 11.8% |
| Icelanders | 34.0 /100 | #182 | Fair 11.8% |
| Hondurans | 31.2 /100 | #183 | Fair 11.8% |
| Iraqis | 30.0 /100 | #184 | Fair 11.8% |
| Immigrants | Burma/Myanmar | 28.5 /100 | #185 | Fair 11.8% |
| Immigrants | Scotland | 28.2 /100 | #186 | Fair 11.8% |
| Lebanese | 27.9 /100 | #187 | Fair 11.8% |
| Immigrants | Mexico | 23.8 /100 | #188 | Fair 11.9% |
| Immigrants | Zaire | 21.8 /100 | #189 | Fair 11.9% |
| Immigrants | West Indies | 21.1 /100 | #190 | Fair 11.9% |
| Ute | 19.5 /100 | #191 | Poor 11.9% |
| Lithuanians | 18.8 /100 | #192 | Poor 11.9% |
| Immigrants | Bosnia and Herzegovina | 18.0 /100 | #193 | Poor 11.9% |
Demographics Similar to Bhutanese by Disability
In terms of disability, the demographic groups most similar to Bhutanese are Uruguayan (11.2%, a difference of 0.0%), Immigrants from Czechoslovakia (11.2%, a difference of 0.010%), Immigrants from Zimbabwe (11.2%, a difference of 0.14%), Immigrants from Greece (11.3%, a difference of 0.18%), and Immigrants from Morocco (11.2%, a difference of 0.21%).
| Demographics | Rating | Rank | Disability |
| Immigrants | Brazil | 98.1 /100 | #90 | Exceptional 11.2% |
| Immigrants | Western Asia | 98.1 /100 | #91 | Exceptional 11.2% |
| Ecuadorians | 98.0 /100 | #92 | Exceptional 11.2% |
| Immigrants | Ecuador | 98.0 /100 | #93 | Exceptional 11.2% |
| Immigrants | Morocco | 97.8 /100 | #94 | Exceptional 11.2% |
| Eastern Europeans | 97.8 /100 | #95 | Exceptional 11.2% |
| Immigrants | Zimbabwe | 97.7 /100 | #96 | Exceptional 11.2% |
| Bhutanese | 97.4 /100 | #97 | Exceptional 11.2% |
| Uruguayans | 97.4 /100 | #98 | Exceptional 11.2% |
| Immigrants | Czechoslovakia | 97.4 /100 | #99 | Exceptional 11.2% |
| Immigrants | Greece | 96.9 /100 | #100 | Exceptional 11.3% |
| Immigrants | Nicaragua | 96.8 /100 | #101 | Exceptional 11.3% |
| Immigrants | Eastern Africa | 96.7 /100 | #102 | Exceptional 11.3% |
| Immigrants | Uruguay | 96.4 /100 | #103 | Exceptional 11.3% |
| Immigrants | Immigrants | 96.4 /100 | #104 | Exceptional 11.3% |