Immigrants from Scotland vs Immigrants from the Azores Disability
COMPARE
Immigrants from Scotland
Immigrants from the Azores
Disability
Disability Comparison
Immigrants from Scotland
Immigrants from the Azores
11.8%
DISABILITY
28.2/ 100
METRIC RATING
186th/ 347
METRIC RANK
14.2%
DISABILITY
0.0/ 100
METRIC RATING
328th/ 347
METRIC RANK
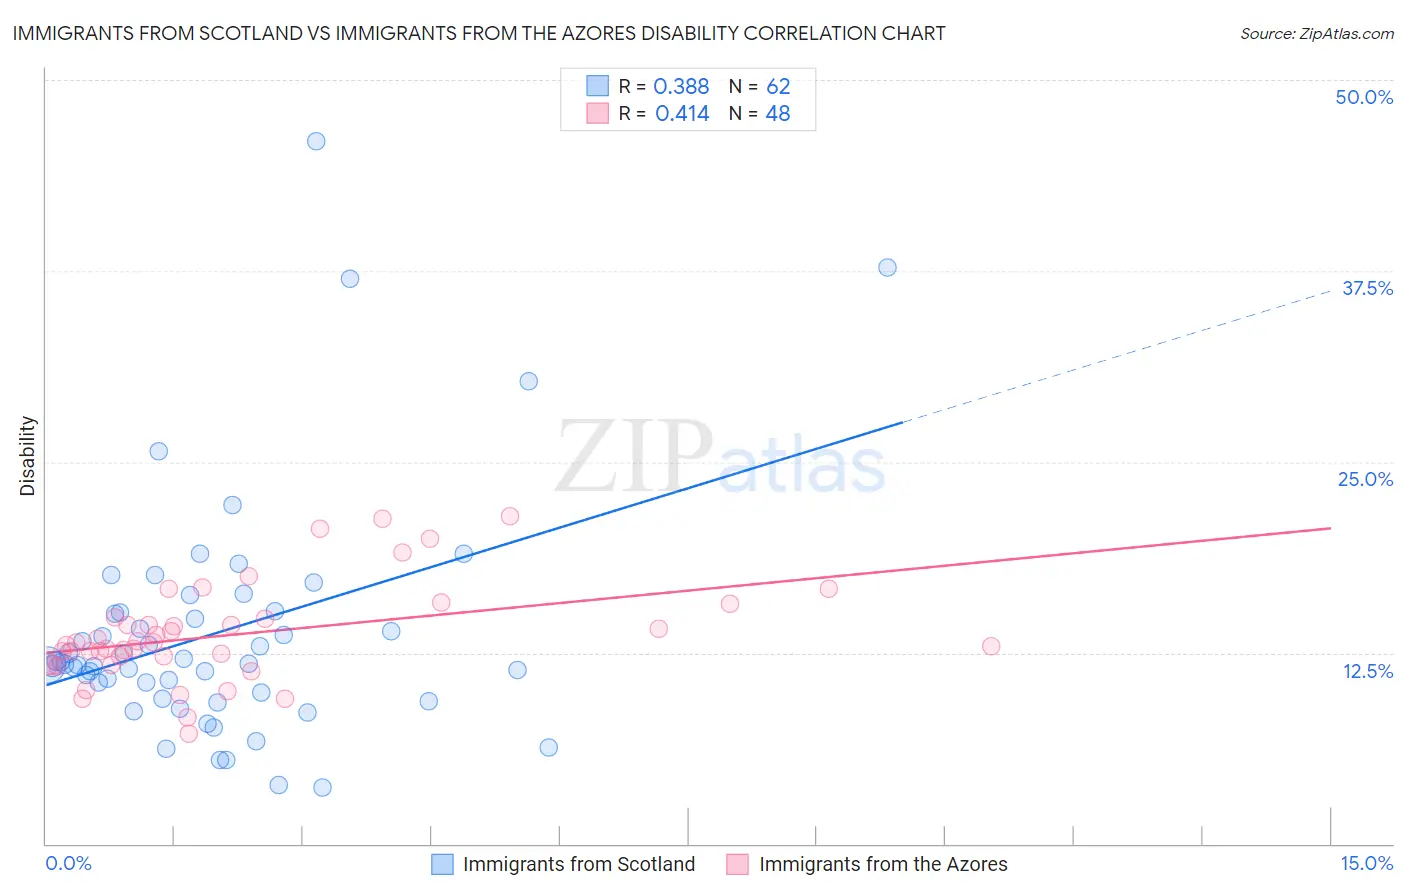
Immigrants from Scotland vs Immigrants from the Azores Disability Correlation Chart
The statistical analysis conducted on geographies consisting of 196,399,037 people shows a mild positive correlation between the proportion of Immigrants from Scotland and percentage of population with a disability in the United States with a correlation coefficient (R) of 0.388 and weighted average of 11.8%. Similarly, the statistical analysis conducted on geographies consisting of 46,257,178 people shows a moderate positive correlation between the proportion of Immigrants from the Azores and percentage of population with a disability in the United States with a correlation coefficient (R) of 0.414 and weighted average of 14.2%, a difference of 19.8%.
Disability Correlation Summary
| Measurement | Immigrants from Scotland | Immigrants from the Azores |
| Minimum | 3.7% | 7.2% |
| Maximum | 46.0% | 21.5% |
| Range | 42.3% | 14.3% |
| Mean | 13.8% | 13.7% |
| Median | 11.8% | 13.1% |
| Interquartile 25% (IQ1) | 9.9% | 12.0% |
| Interquartile 75% (IQ3) | 15.1% | 14.8% |
| Interquartile Range (IQR) | 5.2% | 2.7% |
| Standard Deviation (Sample) | 7.7% | 3.2% |
| Standard Deviation (Population) | 7.6% | 3.1% |
Similar Demographics by Disability
Demographics Similar to Immigrants from Scotland by Disability
In terms of disability, the demographic groups most similar to Immigrants from Scotland are Immigrants from Burma/Myanmar (11.8%, a difference of 0.010%), Lebanese (11.8%, a difference of 0.020%), Iraqi (11.8%, a difference of 0.090%), Honduran (11.8%, a difference of 0.16%), and Immigrants from Mexico (11.9%, a difference of 0.26%).
| Demographics | Rating | Rank | Disability |
| Immigrants | Armenia | 41.9 /100 | #179 | Average 11.7% |
| Immigrants | Honduras | 37.8 /100 | #180 | Fair 11.8% |
| Immigrants | Oceania | 34.3 /100 | #181 | Fair 11.8% |
| Icelanders | 34.0 /100 | #182 | Fair 11.8% |
| Hondurans | 31.2 /100 | #183 | Fair 11.8% |
| Iraqis | 30.0 /100 | #184 | Fair 11.8% |
| Immigrants | Burma/Myanmar | 28.5 /100 | #185 | Fair 11.8% |
| Immigrants | Scotland | 28.2 /100 | #186 | Fair 11.8% |
| Lebanese | 27.9 /100 | #187 | Fair 11.8% |
| Immigrants | Mexico | 23.8 /100 | #188 | Fair 11.9% |
| Immigrants | Zaire | 21.8 /100 | #189 | Fair 11.9% |
| Immigrants | West Indies | 21.1 /100 | #190 | Fair 11.9% |
| Ute | 19.5 /100 | #191 | Poor 11.9% |
| Lithuanians | 18.8 /100 | #192 | Poor 11.9% |
| Immigrants | Bosnia and Herzegovina | 18.0 /100 | #193 | Poor 11.9% |
Demographics Similar to Immigrants from the Azores by Disability
In terms of disability, the demographic groups most similar to Immigrants from the Azores are Ottawa (14.2%, a difference of 0.0%), Osage (14.2%, a difference of 0.020%), Native/Alaskan (14.2%, a difference of 0.060%), Chippewa (14.1%, a difference of 0.10%), and Potawatomi (14.2%, a difference of 0.12%).
| Demographics | Rating | Rank | Disability |
| Paiute | 0.0 /100 | #321 | Tragic 13.9% |
| Americans | 0.0 /100 | #322 | Tragic 13.9% |
| Comanche | 0.0 /100 | #323 | Tragic 14.1% |
| Chippewa | 0.0 /100 | #324 | Tragic 14.1% |
| Natives/Alaskans | 0.0 /100 | #325 | Tragic 14.2% |
| Osage | 0.0 /100 | #326 | Tragic 14.2% |
| Ottawa | 0.0 /100 | #327 | Tragic 14.2% |
| Immigrants | Azores | 0.0 /100 | #328 | Tragic 14.2% |
| Potawatomi | 0.0 /100 | #329 | Tragic 14.2% |
| Navajo | 0.0 /100 | #330 | Tragic 14.3% |
| Alaskan Athabascans | 0.0 /100 | #331 | Tragic 14.4% |
| Pueblo | 0.0 /100 | #332 | Tragic 14.4% |
| Cajuns | 0.0 /100 | #333 | Tragic 14.6% |
| Yuman | 0.0 /100 | #334 | Tragic 14.6% |
| Tohono O'odham | 0.0 /100 | #335 | Tragic 14.8% |