Hispanic or Latino vs Bhutanese Disability
COMPARE
Hispanic or Latino
Bhutanese
Disability
Disability Comparison
Hispanics or Latinos
Bhutanese
12.1%
DISABILITY
3.9/ 100
METRIC RATING
223rd/ 347
METRIC RANK
11.2%
DISABILITY
97.4/ 100
METRIC RATING
97th/ 347
METRIC RANK
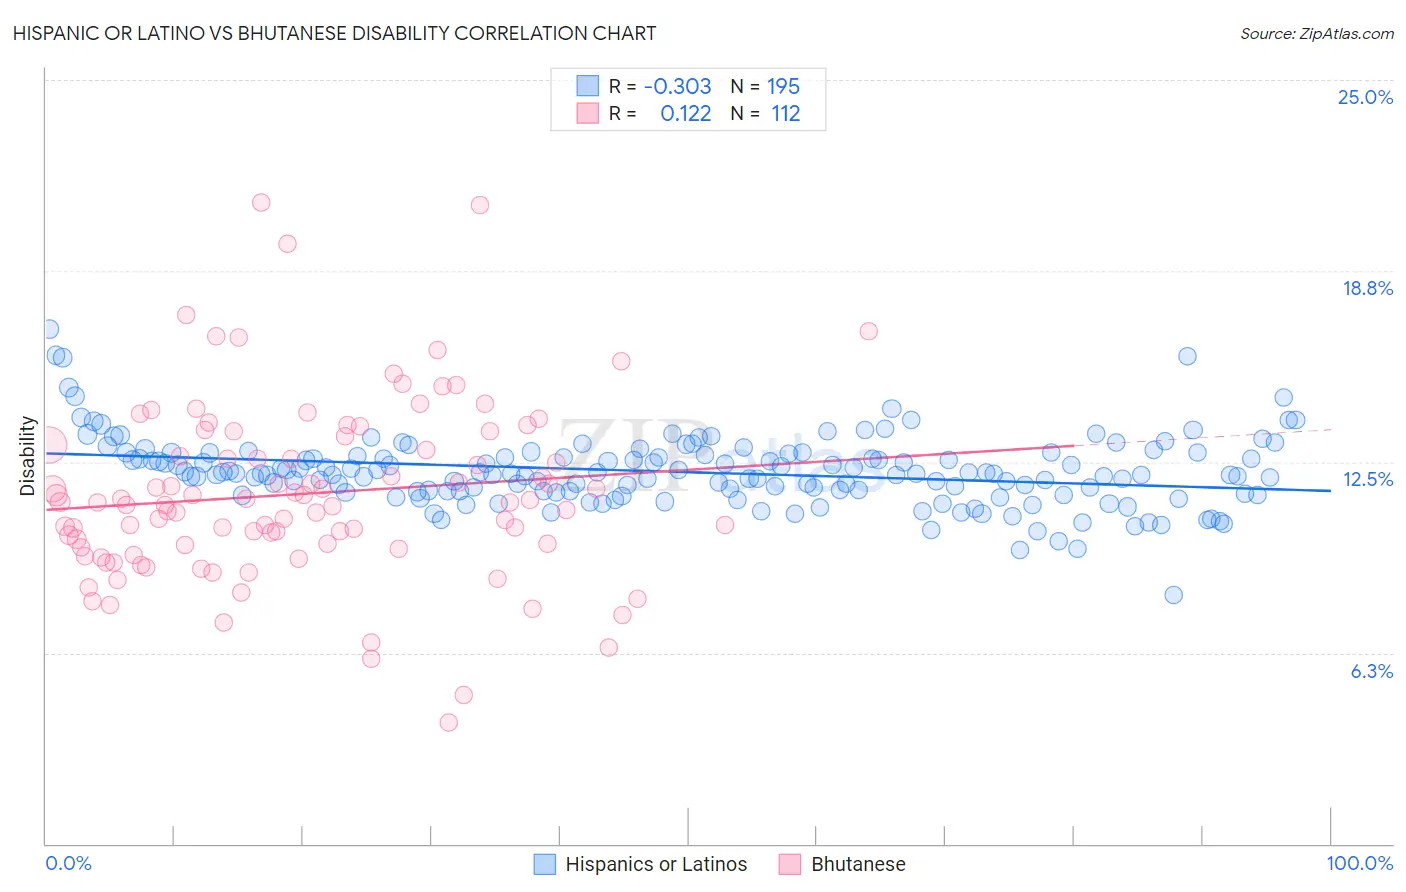
Hispanic or Latino vs Bhutanese Disability Correlation Chart
The statistical analysis conducted on geographies consisting of 572,941,997 people shows a mild negative correlation between the proportion of Hispanics or Latinos and percentage of population with a disability in the United States with a correlation coefficient (R) of -0.303 and weighted average of 12.1%. Similarly, the statistical analysis conducted on geographies consisting of 455,521,093 people shows a poor positive correlation between the proportion of Bhutanese and percentage of population with a disability in the United States with a correlation coefficient (R) of 0.122 and weighted average of 11.2%, a difference of 7.9%.
Disability Correlation Summary
| Measurement | Hispanic or Latino | Bhutanese |
| Minimum | 8.1% | 4.0% |
| Maximum | 16.8% | 21.0% |
| Range | 8.7% | 17.0% |
| Mean | 12.2% | 11.5% |
| Median | 12.1% | 11.2% |
| Interquartile 25% (IQ1) | 11.5% | 9.7% |
| Interquartile 75% (IQ3) | 12.7% | 13.2% |
| Interquartile Range (IQR) | 1.2% | 3.5% |
| Standard Deviation (Sample) | 1.1% | 2.9% |
| Standard Deviation (Population) | 1.1% | 2.9% |
Similar Demographics by Disability
Demographics Similar to Hispanics or Latinos by Disability
In terms of disability, the demographic groups most similar to Hispanics or Latinos are Spanish American Indian (12.1%, a difference of 0.040%), Mexican (12.1%, a difference of 0.060%), Northern European (12.1%, a difference of 0.070%), Senegalese (12.1%, a difference of 0.15%), and Immigrants from Bahamas (12.1%, a difference of 0.19%).
| Demographics | Rating | Rank | Disability |
| Panamanians | 5.4 /100 | #216 | Tragic 12.1% |
| Immigrants | North America | 5.3 /100 | #217 | Tragic 12.1% |
| Immigrants | Jamaica | 5.0 /100 | #218 | Tragic 12.1% |
| Croatians | 4.9 /100 | #219 | Tragic 12.1% |
| Immigrants | Bahamas | 4.7 /100 | #220 | Tragic 12.1% |
| Northern Europeans | 4.2 /100 | #221 | Tragic 12.1% |
| Spanish American Indians | 4.1 /100 | #222 | Tragic 12.1% |
| Hispanics or Latinos | 3.9 /100 | #223 | Tragic 12.1% |
| Mexicans | 3.7 /100 | #224 | Tragic 12.1% |
| Senegalese | 3.5 /100 | #225 | Tragic 12.1% |
| Jamaicans | 3.3 /100 | #226 | Tragic 12.1% |
| Alsatians | 3.3 /100 | #227 | Tragic 12.1% |
| West Indians | 2.9 /100 | #228 | Tragic 12.2% |
| Inupiat | 2.8 /100 | #229 | Tragic 12.2% |
| Samoans | 2.6 /100 | #230 | Tragic 12.2% |
Demographics Similar to Bhutanese by Disability
In terms of disability, the demographic groups most similar to Bhutanese are Uruguayan (11.2%, a difference of 0.0%), Immigrants from Czechoslovakia (11.2%, a difference of 0.010%), Immigrants from Zimbabwe (11.2%, a difference of 0.14%), Immigrants from Greece (11.3%, a difference of 0.18%), and Immigrants from Morocco (11.2%, a difference of 0.21%).
| Demographics | Rating | Rank | Disability |
| Immigrants | Brazil | 98.1 /100 | #90 | Exceptional 11.2% |
| Immigrants | Western Asia | 98.1 /100 | #91 | Exceptional 11.2% |
| Ecuadorians | 98.0 /100 | #92 | Exceptional 11.2% |
| Immigrants | Ecuador | 98.0 /100 | #93 | Exceptional 11.2% |
| Immigrants | Morocco | 97.8 /100 | #94 | Exceptional 11.2% |
| Eastern Europeans | 97.8 /100 | #95 | Exceptional 11.2% |
| Immigrants | Zimbabwe | 97.7 /100 | #96 | Exceptional 11.2% |
| Bhutanese | 97.4 /100 | #97 | Exceptional 11.2% |
| Uruguayans | 97.4 /100 | #98 | Exceptional 11.2% |
| Immigrants | Czechoslovakia | 97.4 /100 | #99 | Exceptional 11.2% |
| Immigrants | Greece | 96.9 /100 | #100 | Exceptional 11.3% |
| Immigrants | Nicaragua | 96.8 /100 | #101 | Exceptional 11.3% |
| Immigrants | Eastern Africa | 96.7 /100 | #102 | Exceptional 11.3% |
| Immigrants | Uruguay | 96.4 /100 | #103 | Exceptional 11.3% |
| Immigrants | Immigrants | 96.4 /100 | #104 | Exceptional 11.3% |