Immigrants from Scotland vs Norwegian Disability
COMPARE
Immigrants from Scotland
Norwegian
Disability
Disability Comparison
Immigrants from Scotland
Norwegians
11.8%
DISABILITY
28.2/ 100
METRIC RATING
186th/ 347
METRIC RANK
12.2%
DISABILITY
1.9/ 100
METRIC RATING
238th/ 347
METRIC RANK
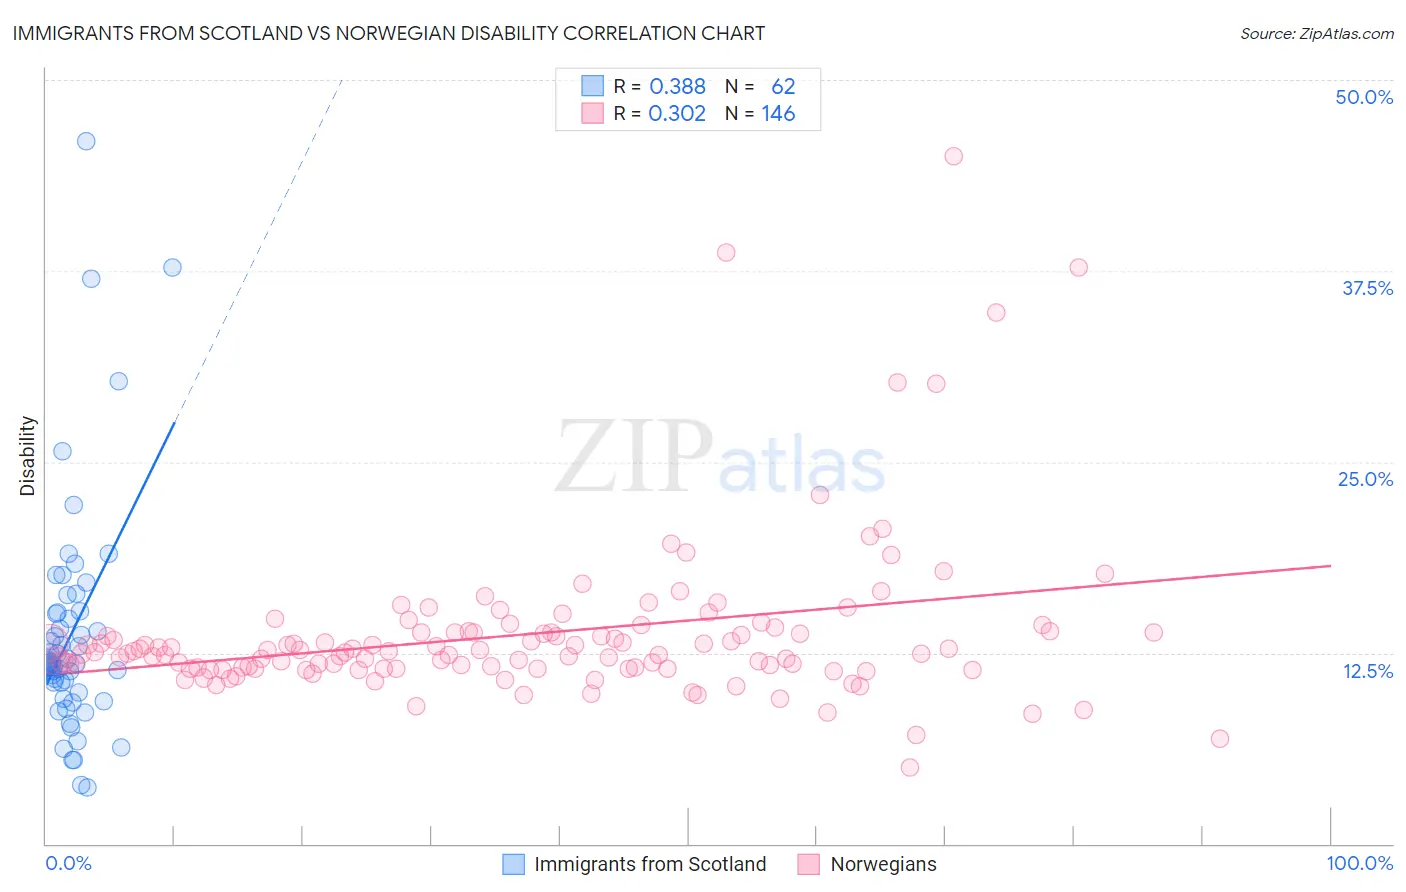
Immigrants from Scotland vs Norwegian Disability Correlation Chart
The statistical analysis conducted on geographies consisting of 196,399,037 people shows a mild positive correlation between the proportion of Immigrants from Scotland and percentage of population with a disability in the United States with a correlation coefficient (R) of 0.388 and weighted average of 11.8%. Similarly, the statistical analysis conducted on geographies consisting of 533,272,047 people shows a mild positive correlation between the proportion of Norwegians and percentage of population with a disability in the United States with a correlation coefficient (R) of 0.302 and weighted average of 12.2%, a difference of 3.3%.
Disability Correlation Summary
| Measurement | Immigrants from Scotland | Norwegian |
| Minimum | 3.7% | 5.0% |
| Maximum | 46.0% | 45.0% |
| Range | 42.3% | 40.0% |
| Mean | 13.8% | 13.7% |
| Median | 11.8% | 12.5% |
| Interquartile 25% (IQ1) | 9.9% | 11.5% |
| Interquartile 75% (IQ3) | 15.1% | 13.8% |
| Interquartile Range (IQR) | 5.2% | 2.3% |
| Standard Deviation (Sample) | 7.7% | 5.4% |
| Standard Deviation (Population) | 7.6% | 5.3% |
Similar Demographics by Disability
Demographics Similar to Immigrants from Scotland by Disability
In terms of disability, the demographic groups most similar to Immigrants from Scotland are Immigrants from Burma/Myanmar (11.8%, a difference of 0.010%), Lebanese (11.8%, a difference of 0.020%), Iraqi (11.8%, a difference of 0.090%), Honduran (11.8%, a difference of 0.16%), and Immigrants from Mexico (11.9%, a difference of 0.26%).
| Demographics | Rating | Rank | Disability |
| Immigrants | Armenia | 41.9 /100 | #179 | Average 11.7% |
| Immigrants | Honduras | 37.8 /100 | #180 | Fair 11.8% |
| Immigrants | Oceania | 34.3 /100 | #181 | Fair 11.8% |
| Icelanders | 34.0 /100 | #182 | Fair 11.8% |
| Hondurans | 31.2 /100 | #183 | Fair 11.8% |
| Iraqis | 30.0 /100 | #184 | Fair 11.8% |
| Immigrants | Burma/Myanmar | 28.5 /100 | #185 | Fair 11.8% |
| Immigrants | Scotland | 28.2 /100 | #186 | Fair 11.8% |
| Lebanese | 27.9 /100 | #187 | Fair 11.8% |
| Immigrants | Mexico | 23.8 /100 | #188 | Fair 11.9% |
| Immigrants | Zaire | 21.8 /100 | #189 | Fair 11.9% |
| Immigrants | West Indies | 21.1 /100 | #190 | Fair 11.9% |
| Ute | 19.5 /100 | #191 | Poor 11.9% |
| Lithuanians | 18.8 /100 | #192 | Poor 11.9% |
| Immigrants | Bosnia and Herzegovina | 18.0 /100 | #193 | Poor 11.9% |
Demographics Similar to Norwegians by Disability
In terms of disability, the demographic groups most similar to Norwegians are Immigrants from Congo (12.2%, a difference of 0.040%), Swedish (12.2%, a difference of 0.040%), Chinese (12.2%, a difference of 0.090%), Hungarian (12.2%, a difference of 0.090%), and Yugoslavian (12.2%, a difference of 0.090%).
| Demographics | Rating | Rank | Disability |
| Malaysians | 2.5 /100 | #231 | Tragic 12.2% |
| Italians | 2.5 /100 | #232 | Tragic 12.2% |
| Bahamians | 2.3 /100 | #233 | Tragic 12.2% |
| Japanese | 2.3 /100 | #234 | Tragic 12.2% |
| Yup'ik | 2.2 /100 | #235 | Tragic 12.2% |
| Chinese | 2.0 /100 | #236 | Tragic 12.2% |
| Immigrants | Congo | 1.9 /100 | #237 | Tragic 12.2% |
| Norwegians | 1.9 /100 | #238 | Tragic 12.2% |
| Swedes | 1.8 /100 | #239 | Tragic 12.2% |
| Hungarians | 1.7 /100 | #240 | Tragic 12.2% |
| Yugoslavians | 1.7 /100 | #241 | Tragic 12.2% |
| Poles | 1.7 /100 | #242 | Tragic 12.2% |
| British | 1.5 /100 | #243 | Tragic 12.2% |
| Basques | 1.5 /100 | #244 | Tragic 12.2% |
| Liberians | 1.5 /100 | #245 | Tragic 12.2% |