Immigrants from Romania vs Israeli Disability
COMPARE
Immigrants from Romania
Israeli
Disability
Disability Comparison
Immigrants from Romania
Israelis
11.2%
DISABILITY
98.5/ 100
METRIC RATING
88th/ 347
METRIC RANK
10.8%
DISABILITY
99.9/ 100
METRIC RATING
43rd/ 347
METRIC RANK
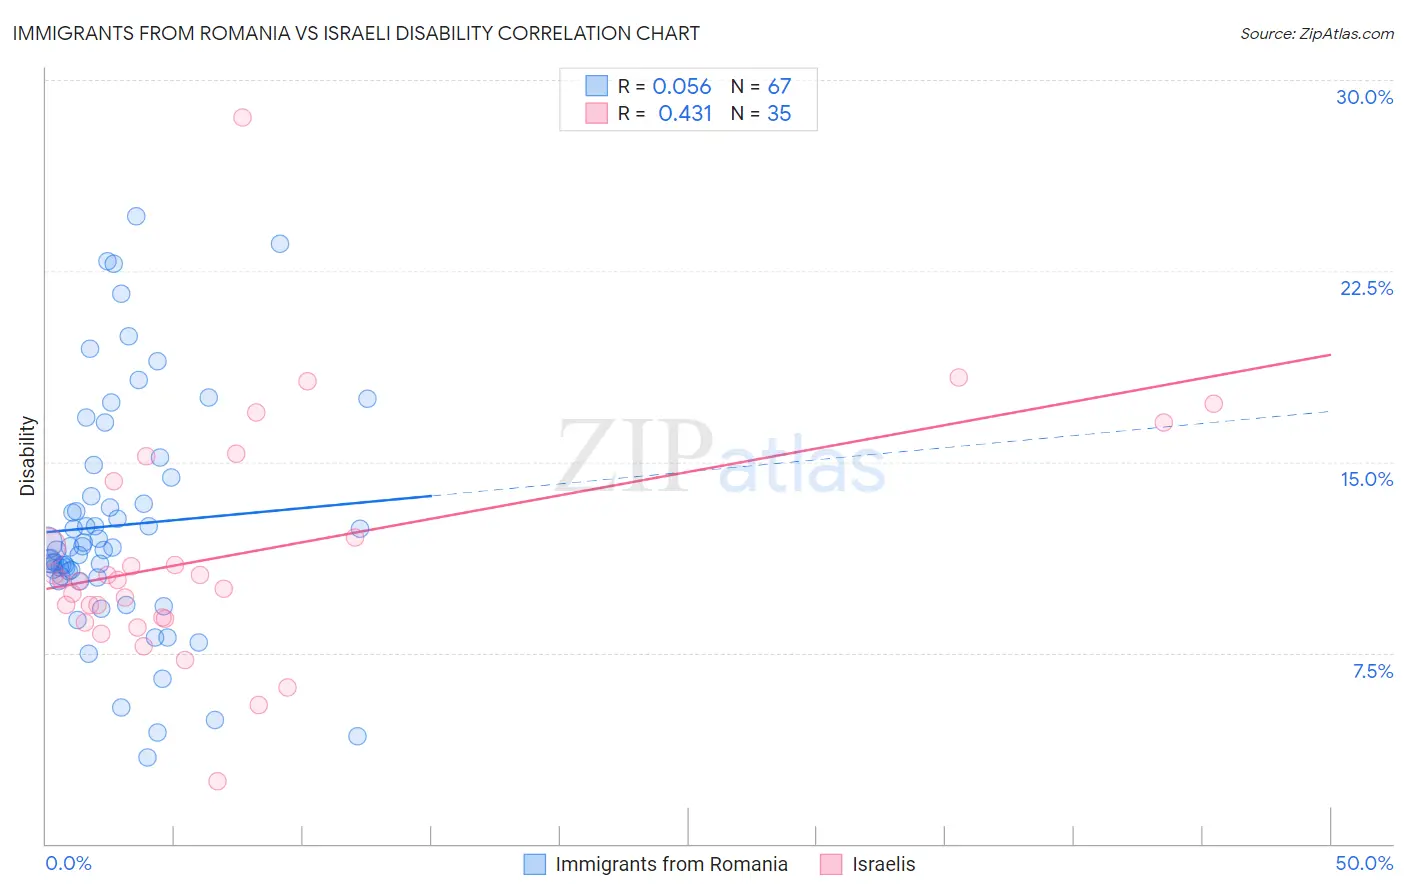
Immigrants from Romania vs Israeli Disability Correlation Chart
The statistical analysis conducted on geographies consisting of 256,993,596 people shows a slight positive correlation between the proportion of Immigrants from Romania and percentage of population with a disability in the United States with a correlation coefficient (R) of 0.056 and weighted average of 11.2%. Similarly, the statistical analysis conducted on geographies consisting of 211,184,121 people shows a moderate positive correlation between the proportion of Israelis and percentage of population with a disability in the United States with a correlation coefficient (R) of 0.431 and weighted average of 10.8%, a difference of 3.4%.
Disability Correlation Summary
| Measurement | Immigrants from Romania | Israeli |
| Minimum | 3.4% | 2.4% |
| Maximum | 24.6% | 28.5% |
| Range | 21.3% | 26.1% |
| Mean | 12.5% | 11.4% |
| Median | 11.6% | 10.4% |
| Interquartile 25% (IQ1) | 10.4% | 8.9% |
| Interquartile 75% (IQ3) | 14.4% | 14.2% |
| Interquartile Range (IQR) | 3.9% | 5.4% |
| Standard Deviation (Sample) | 4.6% | 4.7% |
| Standard Deviation (Population) | 4.6% | 4.6% |
Similar Demographics by Disability
Demographics Similar to Immigrants from Romania by Disability
In terms of disability, the demographic groups most similar to Immigrants from Romania are Immigrants from South Africa (11.2%, a difference of 0.25%), Palestinian (11.1%, a difference of 0.29%), Immigrants from Brazil (11.2%, a difference of 0.30%), Immigrants from Western Asia (11.2%, a difference of 0.32%), and Immigrants from Belarus (11.1%, a difference of 0.33%).
| Demographics | Rating | Rank | Disability |
| Immigrants | Poland | 99.1 /100 | #81 | Exceptional 11.1% |
| Chileans | 99.1 /100 | #82 | Exceptional 11.1% |
| Immigrants | Switzerland | 99.0 /100 | #83 | Exceptional 11.1% |
| Immigrants | Sierra Leone | 99.0 /100 | #84 | Exceptional 11.1% |
| Immigrants | Belarus | 98.9 /100 | #85 | Exceptional 11.1% |
| Immigrants | Russia | 98.9 /100 | #86 | Exceptional 11.1% |
| Palestinians | 98.9 /100 | #87 | Exceptional 11.1% |
| Immigrants | Romania | 98.5 /100 | #88 | Exceptional 11.2% |
| Immigrants | South Africa | 98.2 /100 | #89 | Exceptional 11.2% |
| Immigrants | Brazil | 98.1 /100 | #90 | Exceptional 11.2% |
| Immigrants | Western Asia | 98.1 /100 | #91 | Exceptional 11.2% |
| Ecuadorians | 98.0 /100 | #92 | Exceptional 11.2% |
| Immigrants | Ecuador | 98.0 /100 | #93 | Exceptional 11.2% |
| Immigrants | Morocco | 97.8 /100 | #94 | Exceptional 11.2% |
| Eastern Europeans | 97.8 /100 | #95 | Exceptional 11.2% |
Demographics Similar to Israelis by Disability
In terms of disability, the demographic groups most similar to Israelis are Immigrants from Nepal (10.8%, a difference of 0.050%), Immigrants from Japan (10.8%, a difference of 0.10%), Immigrants from Australia (10.8%, a difference of 0.15%), Cambodian (10.8%, a difference of 0.19%), and Mongolian (10.8%, a difference of 0.19%).
| Demographics | Rating | Rank | Disability |
| Ethiopians | 100.0 /100 | #36 | Exceptional 10.7% |
| Turks | 100.0 /100 | #37 | Exceptional 10.7% |
| Afghans | 99.9 /100 | #38 | Exceptional 10.8% |
| Cambodians | 99.9 /100 | #39 | Exceptional 10.8% |
| Mongolians | 99.9 /100 | #40 | Exceptional 10.8% |
| Immigrants | Australia | 99.9 /100 | #41 | Exceptional 10.8% |
| Immigrants | Nepal | 99.9 /100 | #42 | Exceptional 10.8% |
| Israelis | 99.9 /100 | #43 | Exceptional 10.8% |
| Immigrants | Japan | 99.9 /100 | #44 | Exceptional 10.8% |
| Immigrants | Peru | 99.9 /100 | #45 | Exceptional 10.8% |
| Tongans | 99.9 /100 | #46 | Exceptional 10.8% |
| Taiwanese | 99.9 /100 | #47 | Exceptional 10.8% |
| Soviet Union | 99.9 /100 | #48 | Exceptional 10.9% |
| Vietnamese | 99.9 /100 | #49 | Exceptional 10.9% |
| Immigrants | Saudi Arabia | 99.9 /100 | #50 | Exceptional 10.9% |