Immigrants from Romania vs Panamanian Disability
COMPARE
Immigrants from Romania
Panamanian
Disability
Disability Comparison
Immigrants from Romania
Panamanians
11.2%
DISABILITY
98.5/ 100
METRIC RATING
88th/ 347
METRIC RANK
12.1%
DISABILITY
5.4/ 100
METRIC RATING
216th/ 347
METRIC RANK
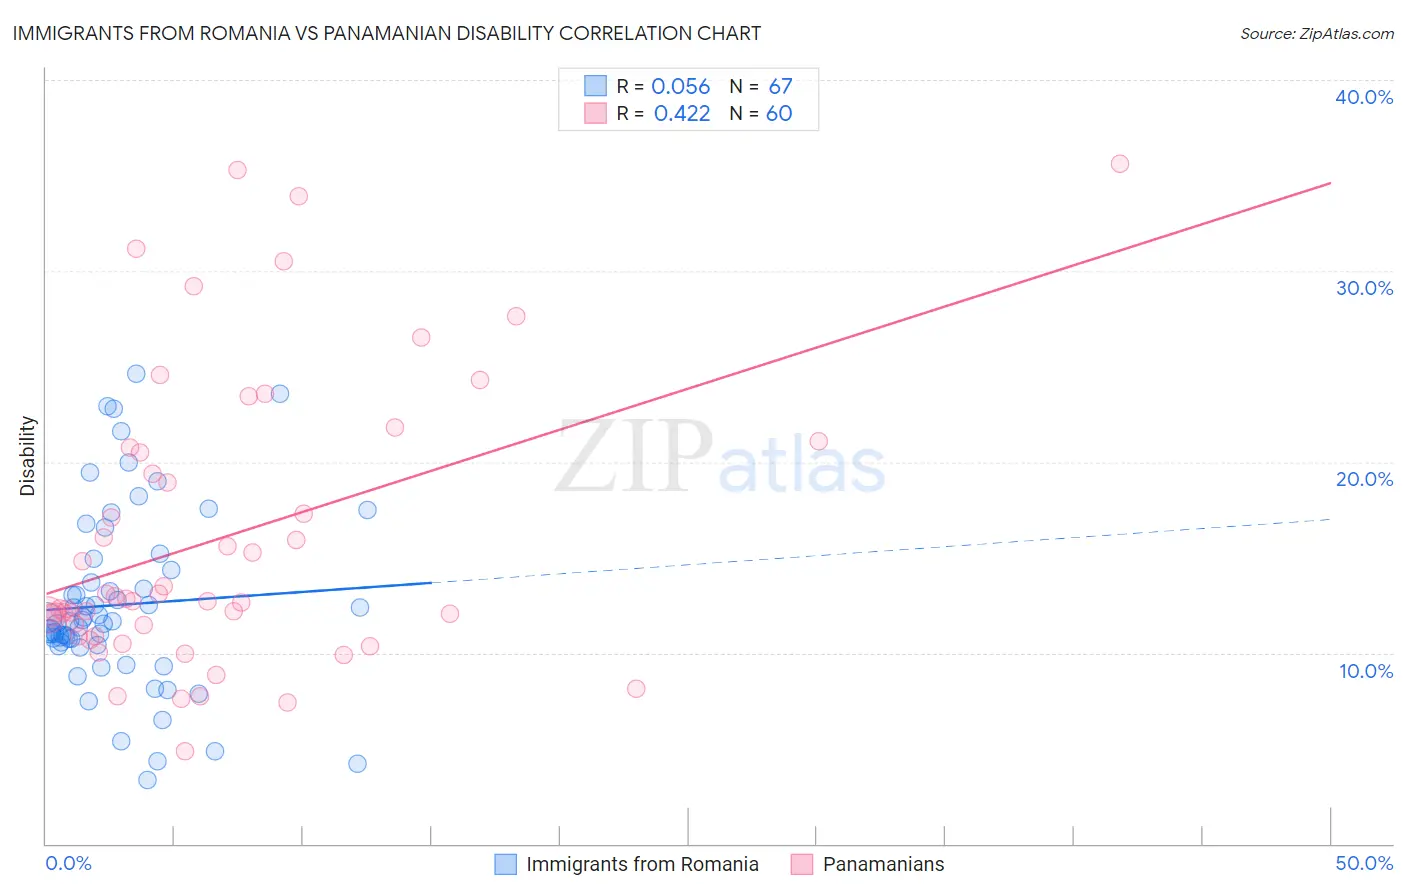
Immigrants from Romania vs Panamanian Disability Correlation Chart
The statistical analysis conducted on geographies consisting of 256,993,596 people shows a slight positive correlation between the proportion of Immigrants from Romania and percentage of population with a disability in the United States with a correlation coefficient (R) of 0.056 and weighted average of 11.2%. Similarly, the statistical analysis conducted on geographies consisting of 281,200,623 people shows a moderate positive correlation between the proportion of Panamanians and percentage of population with a disability in the United States with a correlation coefficient (R) of 0.422 and weighted average of 12.1%, a difference of 8.2%.
Disability Correlation Summary
| Measurement | Immigrants from Romania | Panamanian |
| Minimum | 3.4% | 4.8% |
| Maximum | 24.6% | 35.6% |
| Range | 21.3% | 30.8% |
| Mean | 12.5% | 16.1% |
| Median | 11.6% | 12.8% |
| Interquartile 25% (IQ1) | 10.4% | 11.2% |
| Interquartile 75% (IQ3) | 14.4% | 20.6% |
| Interquartile Range (IQR) | 3.9% | 9.5% |
| Standard Deviation (Sample) | 4.6% | 7.5% |
| Standard Deviation (Population) | 4.6% | 7.5% |
Similar Demographics by Disability
Demographics Similar to Immigrants from Romania by Disability
In terms of disability, the demographic groups most similar to Immigrants from Romania are Immigrants from South Africa (11.2%, a difference of 0.25%), Palestinian (11.1%, a difference of 0.29%), Immigrants from Brazil (11.2%, a difference of 0.30%), Immigrants from Western Asia (11.2%, a difference of 0.32%), and Immigrants from Belarus (11.1%, a difference of 0.33%).
| Demographics | Rating | Rank | Disability |
| Immigrants | Poland | 99.1 /100 | #81 | Exceptional 11.1% |
| Chileans | 99.1 /100 | #82 | Exceptional 11.1% |
| Immigrants | Switzerland | 99.0 /100 | #83 | Exceptional 11.1% |
| Immigrants | Sierra Leone | 99.0 /100 | #84 | Exceptional 11.1% |
| Immigrants | Belarus | 98.9 /100 | #85 | Exceptional 11.1% |
| Immigrants | Russia | 98.9 /100 | #86 | Exceptional 11.1% |
| Palestinians | 98.9 /100 | #87 | Exceptional 11.1% |
| Immigrants | Romania | 98.5 /100 | #88 | Exceptional 11.2% |
| Immigrants | South Africa | 98.2 /100 | #89 | Exceptional 11.2% |
| Immigrants | Brazil | 98.1 /100 | #90 | Exceptional 11.2% |
| Immigrants | Western Asia | 98.1 /100 | #91 | Exceptional 11.2% |
| Ecuadorians | 98.0 /100 | #92 | Exceptional 11.2% |
| Immigrants | Ecuador | 98.0 /100 | #93 | Exceptional 11.2% |
| Immigrants | Morocco | 97.8 /100 | #94 | Exceptional 11.2% |
| Eastern Europeans | 97.8 /100 | #95 | Exceptional 11.2% |
Demographics Similar to Panamanians by Disability
In terms of disability, the demographic groups most similar to Panamanians are Immigrants from North America (12.1%, a difference of 0.010%), Immigrants from Jamaica (12.1%, a difference of 0.070%), Croatian (12.1%, a difference of 0.11%), Immigrants from Canada (12.1%, a difference of 0.15%), and Immigrants from Bahamas (12.1%, a difference of 0.16%).
| Demographics | Rating | Rank | Disability |
| Danes | 8.7 /100 | #209 | Tragic 12.0% |
| Czechs | 7.9 /100 | #210 | Tragic 12.0% |
| Immigrants | Cambodia | 7.3 /100 | #211 | Tragic 12.0% |
| Austrians | 7.2 /100 | #212 | Tragic 12.0% |
| Immigrants | Iraq | 7.1 /100 | #213 | Tragic 12.0% |
| Immigrants | Somalia | 6.8 /100 | #214 | Tragic 12.0% |
| Immigrants | Canada | 6.1 /100 | #215 | Tragic 12.1% |
| Panamanians | 5.4 /100 | #216 | Tragic 12.1% |
| Immigrants | North America | 5.3 /100 | #217 | Tragic 12.1% |
| Immigrants | Jamaica | 5.0 /100 | #218 | Tragic 12.1% |
| Croatians | 4.9 /100 | #219 | Tragic 12.1% |
| Immigrants | Bahamas | 4.7 /100 | #220 | Tragic 12.1% |
| Northern Europeans | 4.2 /100 | #221 | Tragic 12.1% |
| Spanish American Indians | 4.1 /100 | #222 | Tragic 12.1% |
| Hispanics or Latinos | 3.9 /100 | #223 | Tragic 12.1% |