Immigrants from Portugal vs Immigrants from Ghana Disability Age 5 to 17
COMPARE
Immigrants from Portugal
Immigrants from Ghana
Disability Age 5 to 17
Disability Age 5 to 17 Comparison
Immigrants from Portugal
Immigrants from Ghana
6.4%
DISABILITY AGE 5 TO 17
0.0/ 100
METRIC RATING
315th/ 347
METRIC RANK
5.9%
DISABILITY AGE 5 TO 17
1.7/ 100
METRIC RATING
249th/ 347
METRIC RANK
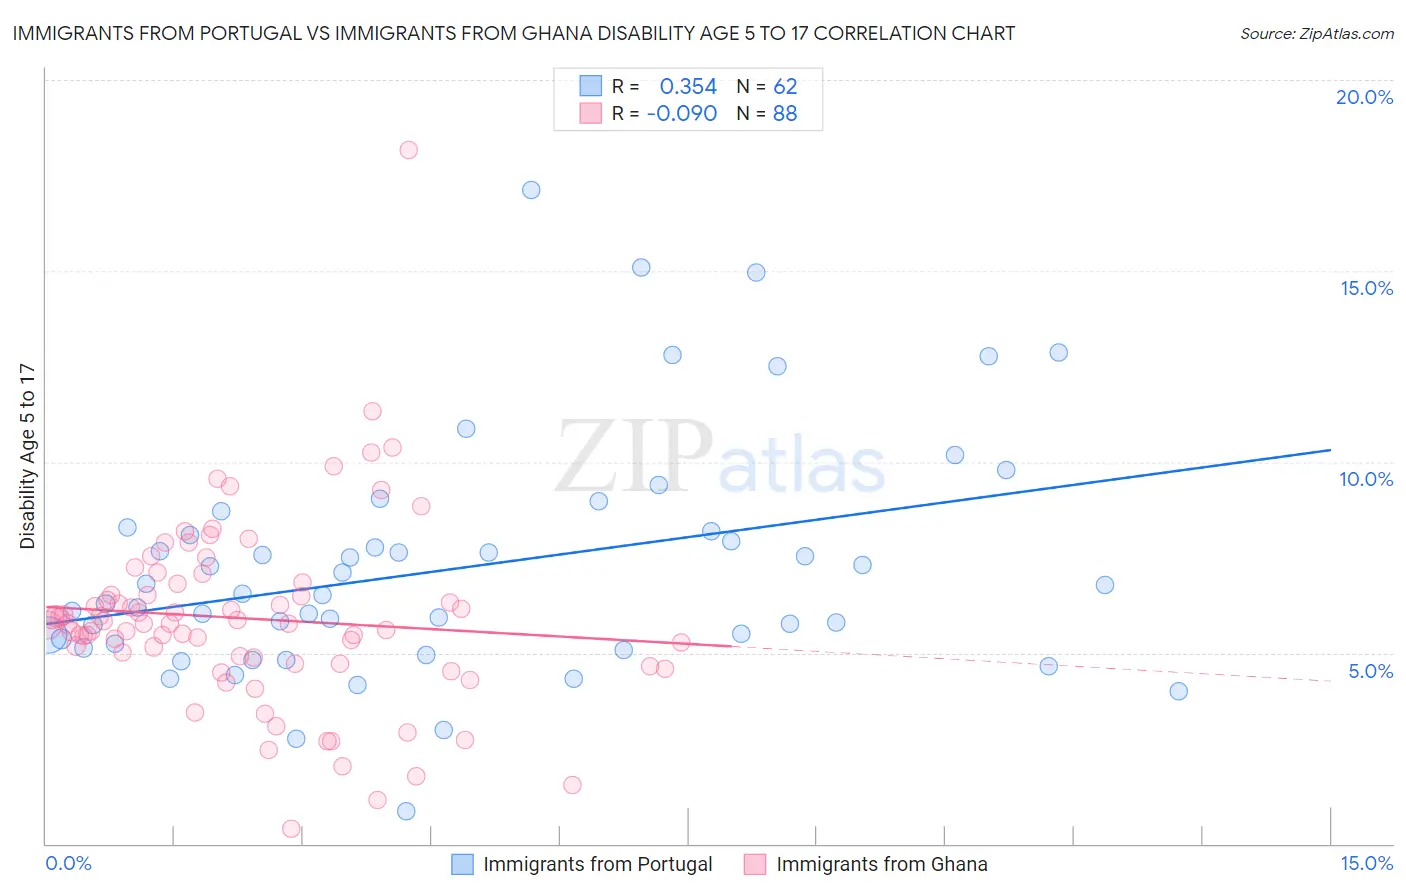
Immigrants from Portugal vs Immigrants from Ghana Disability Age 5 to 17 Correlation Chart
The statistical analysis conducted on geographies consisting of 173,811,905 people shows a mild positive correlation between the proportion of Immigrants from Portugal and percentage of population with a disability between the ages 5 and 17 in the United States with a correlation coefficient (R) of 0.354 and weighted average of 6.4%. Similarly, the statistical analysis conducted on geographies consisting of 199,220,880 people shows a slight negative correlation between the proportion of Immigrants from Ghana and percentage of population with a disability between the ages 5 and 17 in the United States with a correlation coefficient (R) of -0.090 and weighted average of 5.9%, a difference of 9.2%.
Disability Age 5 to 17 Correlation Summary
| Measurement | Immigrants from Portugal | Immigrants from Ghana |
| Minimum | 0.84% | 0.40% |
| Maximum | 17.1% | 18.2% |
| Range | 16.3% | 17.8% |
| Mean | 7.2% | 5.9% |
| Median | 6.5% | 5.8% |
| Interquartile 25% (IQ1) | 5.3% | 4.8% |
| Interquartile 75% (IQ3) | 8.2% | 6.7% |
| Interquartile Range (IQR) | 2.9% | 1.9% |
| Standard Deviation (Sample) | 3.1% | 2.5% |
| Standard Deviation (Population) | 3.1% | 2.4% |
Similar Demographics by Disability Age 5 to 17
Demographics Similar to Immigrants from Portugal by Disability Age 5 to 17
In terms of disability age 5 to 17, the demographic groups most similar to Immigrants from Portugal are French (6.4%, a difference of 0.18%), Immigrants from Dominican Republic (6.4%, a difference of 0.18%), Kiowa (6.4%, a difference of 0.31%), Comanche (6.4%, a difference of 0.34%), and Apache (6.4%, a difference of 0.69%).
| Demographics | Rating | Rank | Disability Age 5 to 17 |
| Scotch-Irish | 0.0 /100 | #308 | Tragic 6.3% |
| Hmong | 0.0 /100 | #309 | Tragic 6.3% |
| Alaskan Athabascans | 0.0 /100 | #310 | Tragic 6.3% |
| Immigrants | Dominica | 0.0 /100 | #311 | Tragic 6.3% |
| Bermudans | 0.0 /100 | #312 | Tragic 6.4% |
| Apache | 0.0 /100 | #313 | Tragic 6.4% |
| French | 0.0 /100 | #314 | Tragic 6.4% |
| Immigrants | Portugal | 0.0 /100 | #315 | Tragic 6.4% |
| Immigrants | Dominican Republic | 0.0 /100 | #316 | Tragic 6.4% |
| Kiowa | 0.0 /100 | #317 | Tragic 6.4% |
| Comanche | 0.0 /100 | #318 | Tragic 6.4% |
| Delaware | 0.0 /100 | #319 | Tragic 6.5% |
| Africans | 0.0 /100 | #320 | Tragic 6.5% |
| Tohono O'odham | 0.0 /100 | #321 | Tragic 6.5% |
| Slovaks | 0.0 /100 | #322 | Tragic 6.5% |
Demographics Similar to Immigrants from Ghana by Disability Age 5 to 17
In terms of disability age 5 to 17, the demographic groups most similar to Immigrants from Ghana are British (5.9%, a difference of 0.010%), Immigrants from Honduras (5.9%, a difference of 0.090%), Immigrants from Germany (5.9%, a difference of 0.12%), Immigrants from Micronesia (5.9%, a difference of 0.12%), and Tlingit-Haida (5.9%, a difference of 0.12%).
| Demographics | Rating | Rank | Disability Age 5 to 17 |
| Spaniards | 2.0 /100 | #242 | Tragic 5.9% |
| Indonesians | 2.0 /100 | #243 | Tragic 5.9% |
| Immigrants | Germany | 1.9 /100 | #244 | Tragic 5.9% |
| Immigrants | Micronesia | 1.9 /100 | #245 | Tragic 5.9% |
| Tlingit-Haida | 1.9 /100 | #246 | Tragic 5.9% |
| Immigrants | Honduras | 1.8 /100 | #247 | Tragic 5.9% |
| British | 1.7 /100 | #248 | Tragic 5.9% |
| Immigrants | Ghana | 1.7 /100 | #249 | Tragic 5.9% |
| Poles | 1.5 /100 | #250 | Tragic 5.9% |
| Immigrants | Cambodia | 1.5 /100 | #251 | Tragic 5.9% |
| Hondurans | 1.5 /100 | #252 | Tragic 5.9% |
| Scandinavians | 1.4 /100 | #253 | Tragic 5.9% |
| Barbadians | 1.3 /100 | #254 | Tragic 5.9% |
| Italians | 1.2 /100 | #255 | Tragic 5.9% |
| Hopi | 1.0 /100 | #256 | Tragic 5.9% |