Immigrants from Poland vs Macedonian Male Disability
COMPARE
Immigrants from Poland
Macedonian
Male Disability
Male Disability Comparison
Immigrants from Poland
Macedonians
10.6%
MALE DISABILITY
98.1/ 100
METRIC RATING
83rd/ 347
METRIC RANK
11.0%
MALE DISABILITY
84.2/ 100
METRIC RATING
131st/ 347
METRIC RANK
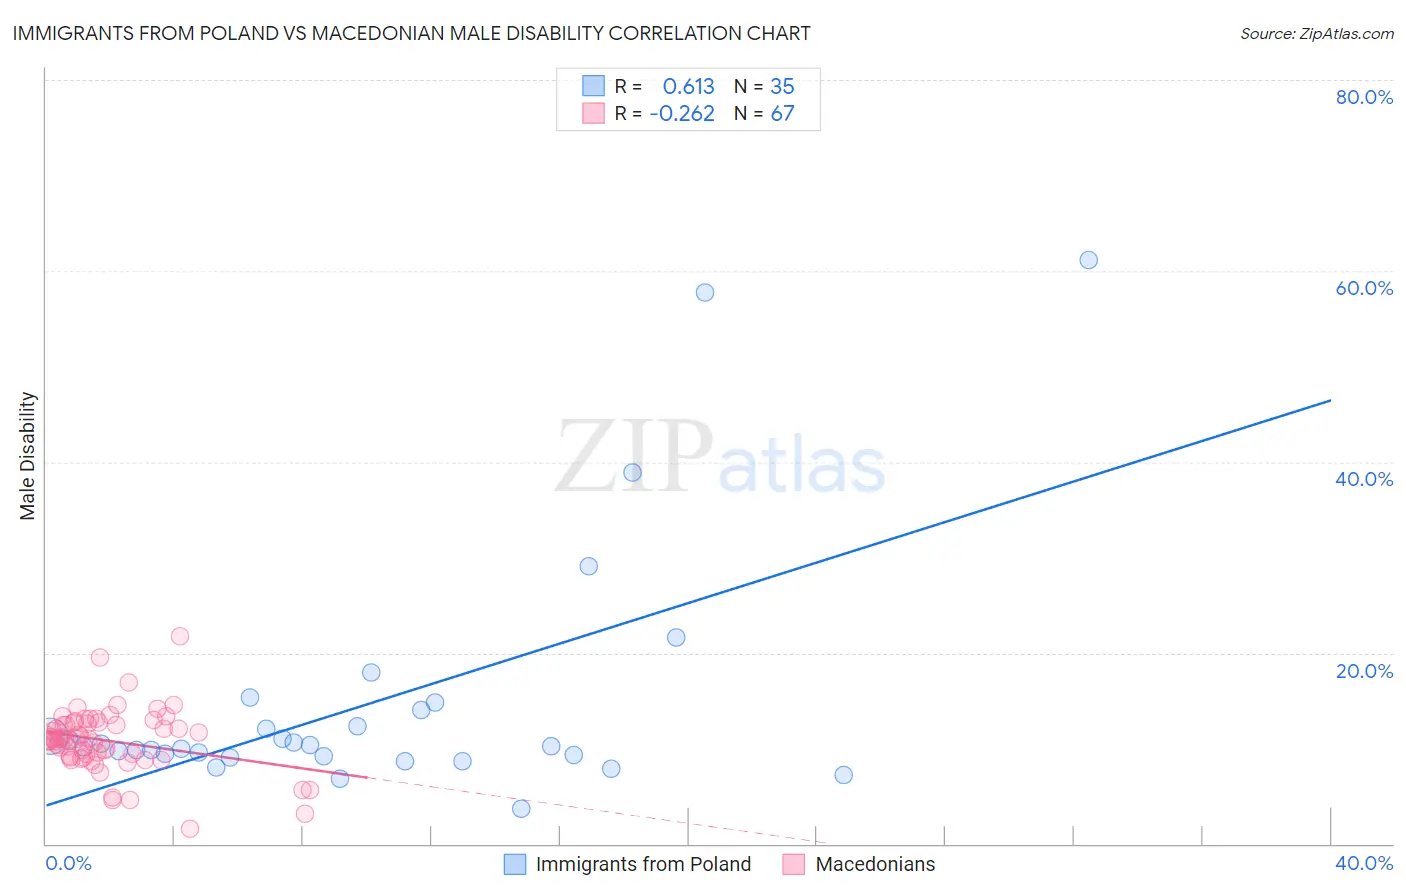
Immigrants from Poland vs Macedonian Male Disability Correlation Chart
The statistical analysis conducted on geographies consisting of 304,827,487 people shows a significant positive correlation between the proportion of Immigrants from Poland and percentage of males with a disability in the United States with a correlation coefficient (R) of 0.613 and weighted average of 10.6%. Similarly, the statistical analysis conducted on geographies consisting of 132,656,892 people shows a weak negative correlation between the proportion of Macedonians and percentage of males with a disability in the United States with a correlation coefficient (R) of -0.262 and weighted average of 11.0%, a difference of 3.4%.
Male Disability Correlation Summary
| Measurement | Immigrants from Poland | Macedonian |
| Minimum | 3.6% | 1.6% |
| Maximum | 61.1% | 21.7% |
| Range | 57.5% | 20.1% |
| Mean | 14.8% | 10.8% |
| Median | 10.2% | 11.0% |
| Interquartile 25% (IQ1) | 9.2% | 9.1% |
| Interquartile 75% (IQ3) | 14.0% | 12.7% |
| Interquartile Range (IQR) | 4.8% | 3.6% |
| Standard Deviation (Sample) | 12.9% | 3.3% |
| Standard Deviation (Population) | 12.7% | 3.3% |
Similar Demographics by Male Disability
Demographics Similar to Immigrants from Poland by Male Disability
In terms of male disability, the demographic groups most similar to Immigrants from Poland are Bulgarian (10.6%, a difference of 0.010%), Immigrants from Guyana (10.6%, a difference of 0.060%), Immigrants from Chile (10.6%, a difference of 0.13%), Immigrants from Jordan (10.6%, a difference of 0.19%), and Sri Lankan (10.6%, a difference of 0.19%).
| Demographics | Rating | Rank | Male Disability |
| Immigrants | Sierra Leone | 98.7 /100 | #76 | Exceptional 10.5% |
| Laotians | 98.6 /100 | #77 | Exceptional 10.6% |
| Immigrants | Russia | 98.6 /100 | #78 | Exceptional 10.6% |
| Zimbabweans | 98.4 /100 | #79 | Exceptional 10.6% |
| Immigrants | Jordan | 98.4 /100 | #80 | Exceptional 10.6% |
| Immigrants | Chile | 98.3 /100 | #81 | Exceptional 10.6% |
| Immigrants | Guyana | 98.2 /100 | #82 | Exceptional 10.6% |
| Immigrants | Poland | 98.1 /100 | #83 | Exceptional 10.6% |
| Bulgarians | 98.1 /100 | #84 | Exceptional 10.6% |
| Sri Lankans | 97.9 /100 | #85 | Exceptional 10.6% |
| Immigrants | Ireland | 97.9 /100 | #86 | Exceptional 10.6% |
| Immigrants | Vietnam | 97.9 /100 | #87 | Exceptional 10.6% |
| Immigrants | Western Asia | 97.8 /100 | #88 | Exceptional 10.6% |
| Immigrants | Nicaragua | 97.8 /100 | #89 | Exceptional 10.6% |
| Immigrants | Morocco | 97.7 /100 | #90 | Exceptional 10.6% |
Demographics Similar to Macedonians by Male Disability
In terms of male disability, the demographic groups most similar to Macedonians are Immigrants from Fiji (11.0%, a difference of 0.020%), Ugandan (11.0%, a difference of 0.030%), Bhutanese (11.0%, a difference of 0.080%), Trinidadian and Tobagonian (11.0%, a difference of 0.10%), and Immigrants from Latvia (10.9%, a difference of 0.14%).
| Demographics | Rating | Rank | Male Disability |
| South American Indians | 88.1 /100 | #124 | Excellent 10.9% |
| Immigrants | North Macedonia | 88.1 /100 | #125 | Excellent 10.9% |
| Immigrants | Trinidad and Tobago | 86.9 /100 | #126 | Excellent 10.9% |
| Immigrants | Ukraine | 86.8 /100 | #127 | Excellent 10.9% |
| Immigrants | Latvia | 85.5 /100 | #128 | Excellent 10.9% |
| Immigrants | Philippines | 85.4 /100 | #129 | Excellent 10.9% |
| Brazilians | 85.4 /100 | #130 | Excellent 10.9% |
| Macedonians | 84.2 /100 | #131 | Excellent 11.0% |
| Immigrants | Fiji | 84.0 /100 | #132 | Excellent 11.0% |
| Ugandans | 83.9 /100 | #133 | Excellent 11.0% |
| Bhutanese | 83.4 /100 | #134 | Excellent 11.0% |
| Trinidadians and Tobagonians | 83.3 /100 | #135 | Excellent 11.0% |
| Immigrants | Costa Rica | 82.8 /100 | #136 | Excellent 11.0% |
| Immigrants | Europe | 82.0 /100 | #137 | Excellent 11.0% |
| Nigerians | 81.9 /100 | #138 | Excellent 11.0% |