Immigrants from Poland vs Maltese Male Disability
COMPARE
Immigrants from Poland
Maltese
Male Disability
Male Disability Comparison
Immigrants from Poland
Maltese
10.6%
MALE DISABILITY
98.1/ 100
METRIC RATING
83rd/ 347
METRIC RANK
11.2%
MALE DISABILITY
50.0/ 100
METRIC RATING
174th/ 347
METRIC RANK
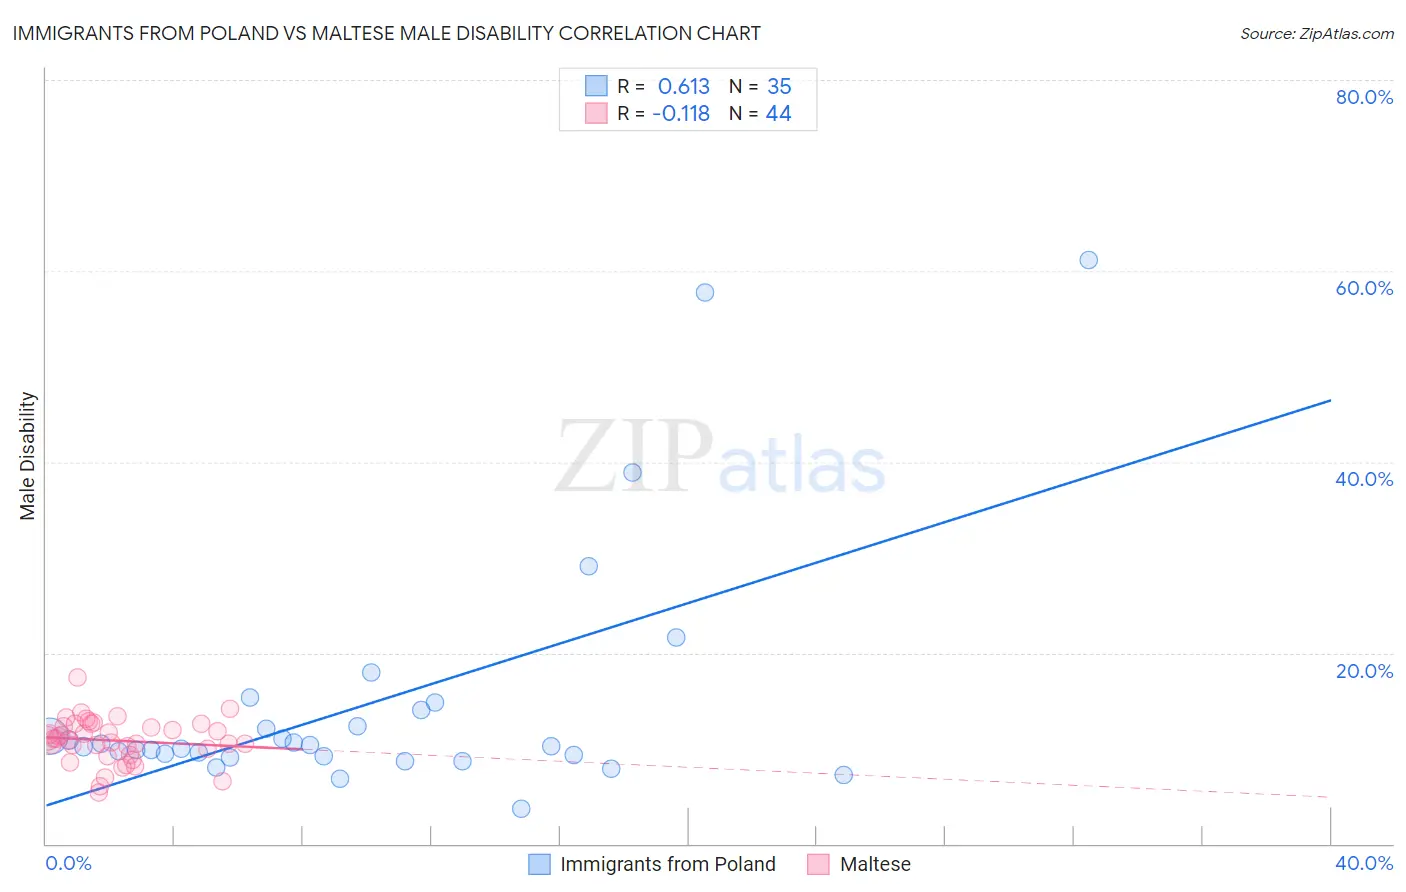
Immigrants from Poland vs Maltese Male Disability Correlation Chart
The statistical analysis conducted on geographies consisting of 304,827,487 people shows a significant positive correlation between the proportion of Immigrants from Poland and percentage of males with a disability in the United States with a correlation coefficient (R) of 0.613 and weighted average of 10.6%. Similarly, the statistical analysis conducted on geographies consisting of 126,476,999 people shows a poor negative correlation between the proportion of Maltese and percentage of males with a disability in the United States with a correlation coefficient (R) of -0.118 and weighted average of 11.2%, a difference of 5.8%.
Male Disability Correlation Summary
| Measurement | Immigrants from Poland | Maltese |
| Minimum | 3.6% | 5.3% |
| Maximum | 61.1% | 17.4% |
| Range | 57.5% | 12.1% |
| Mean | 14.8% | 10.8% |
| Median | 10.2% | 11.0% |
| Interquartile 25% (IQ1) | 9.2% | 9.6% |
| Interquartile 75% (IQ3) | 14.0% | 12.4% |
| Interquartile Range (IQR) | 4.8% | 2.8% |
| Standard Deviation (Sample) | 12.9% | 2.3% |
| Standard Deviation (Population) | 12.7% | 2.3% |
Similar Demographics by Male Disability
Demographics Similar to Immigrants from Poland by Male Disability
In terms of male disability, the demographic groups most similar to Immigrants from Poland are Bulgarian (10.6%, a difference of 0.010%), Immigrants from Guyana (10.6%, a difference of 0.060%), Immigrants from Chile (10.6%, a difference of 0.13%), Immigrants from Jordan (10.6%, a difference of 0.19%), and Sri Lankan (10.6%, a difference of 0.19%).
| Demographics | Rating | Rank | Male Disability |
| Immigrants | Sierra Leone | 98.7 /100 | #76 | Exceptional 10.5% |
| Laotians | 98.6 /100 | #77 | Exceptional 10.6% |
| Immigrants | Russia | 98.6 /100 | #78 | Exceptional 10.6% |
| Zimbabweans | 98.4 /100 | #79 | Exceptional 10.6% |
| Immigrants | Jordan | 98.4 /100 | #80 | Exceptional 10.6% |
| Immigrants | Chile | 98.3 /100 | #81 | Exceptional 10.6% |
| Immigrants | Guyana | 98.2 /100 | #82 | Exceptional 10.6% |
| Immigrants | Poland | 98.1 /100 | #83 | Exceptional 10.6% |
| Bulgarians | 98.1 /100 | #84 | Exceptional 10.6% |
| Sri Lankans | 97.9 /100 | #85 | Exceptional 10.6% |
| Immigrants | Ireland | 97.9 /100 | #86 | Exceptional 10.6% |
| Immigrants | Vietnam | 97.9 /100 | #87 | Exceptional 10.6% |
| Immigrants | Western Asia | 97.8 /100 | #88 | Exceptional 10.6% |
| Immigrants | Nicaragua | 97.8 /100 | #89 | Exceptional 10.6% |
| Immigrants | Morocco | 97.7 /100 | #90 | Exceptional 10.6% |
Demographics Similar to Maltese by Male Disability
In terms of male disability, the demographic groups most similar to Maltese are Immigrants from Burma/Myanmar (11.2%, a difference of 0.020%), Romanian (11.2%, a difference of 0.040%), Immigrants from Honduras (11.2%, a difference of 0.070%), Haitian (11.2%, a difference of 0.14%), and New Zealander (11.2%, a difference of 0.16%).
| Demographics | Rating | Rank | Male Disability |
| Immigrants | Southern Europe | 54.4 /100 | #167 | Average 11.2% |
| Immigrants | Latin America | 54.0 /100 | #168 | Average 11.2% |
| Barbadians | 53.4 /100 | #169 | Average 11.2% |
| New Zealanders | 52.9 /100 | #170 | Average 11.2% |
| Haitians | 52.5 /100 | #171 | Average 11.2% |
| Romanians | 50.7 /100 | #172 | Average 11.2% |
| Immigrants | Burma/Myanmar | 50.4 /100 | #173 | Average 11.2% |
| Maltese | 50.0 /100 | #174 | Average 11.2% |
| Immigrants | Honduras | 48.7 /100 | #175 | Average 11.2% |
| Syrians | 46.6 /100 | #176 | Average 11.2% |
| Immigrants | Norway | 44.2 /100 | #177 | Average 11.3% |
| Australians | 42.2 /100 | #178 | Average 11.3% |
| Immigrants | Caribbean | 41.4 /100 | #179 | Average 11.3% |
| Hondurans | 41.1 /100 | #180 | Average 11.3% |
| Immigrants | Senegal | 34.4 /100 | #181 | Fair 11.3% |