Immigrants from Norway vs Basque Disability
COMPARE
Immigrants from Norway
Basque
Disability
Disability Comparison
Immigrants from Norway
Basques
11.6%
DISABILITY
73.2/ 100
METRIC RATING
149th/ 347
METRIC RANK
12.2%
DISABILITY
1.5/ 100
METRIC RATING
244th/ 347
METRIC RANK
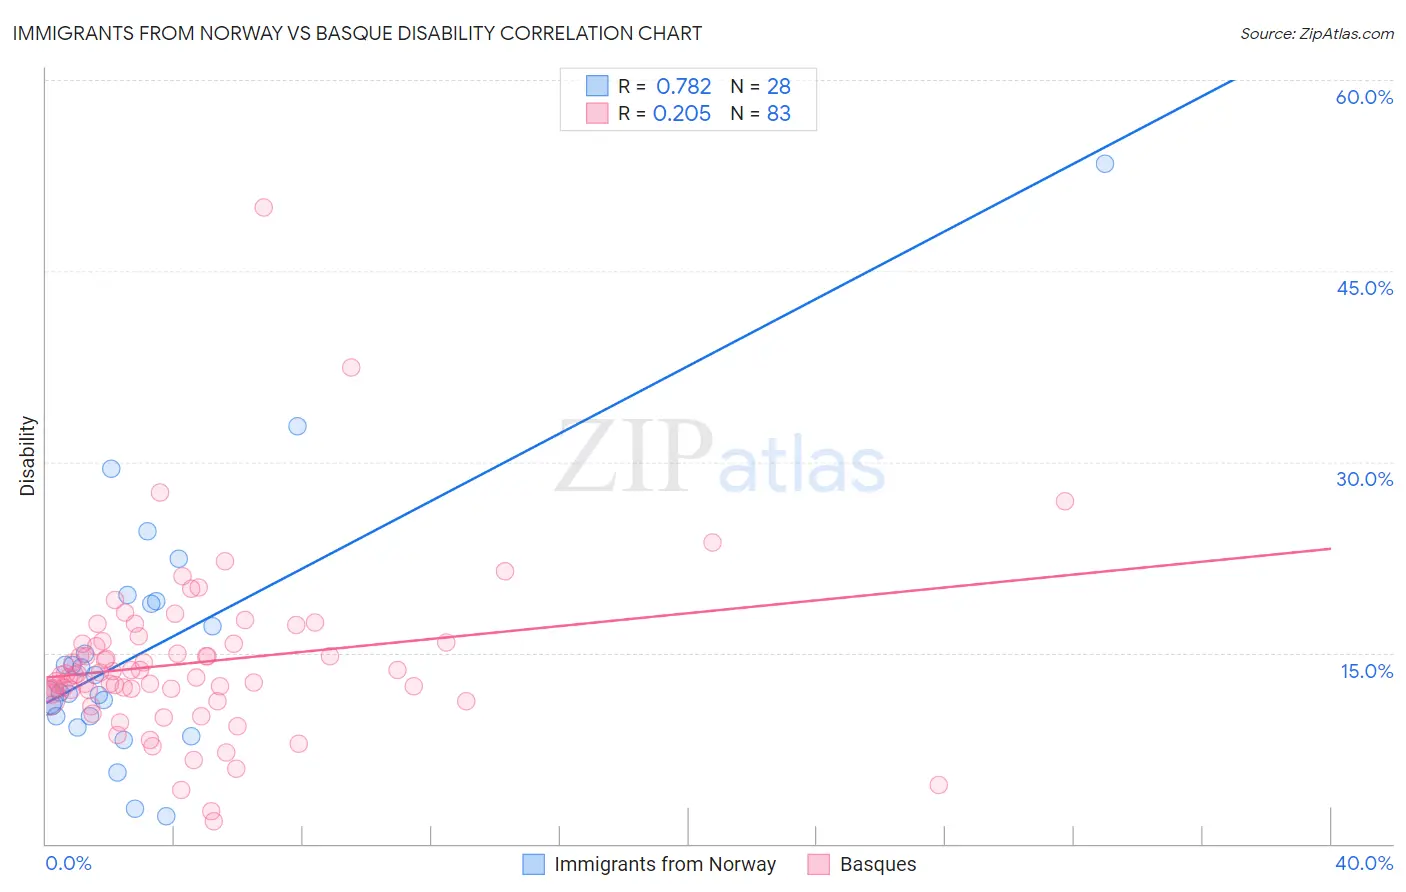
Immigrants from Norway vs Basque Disability Correlation Chart
The statistical analysis conducted on geographies consisting of 116,706,473 people shows a strong positive correlation between the proportion of Immigrants from Norway and percentage of population with a disability in the United States with a correlation coefficient (R) of 0.782 and weighted average of 11.6%. Similarly, the statistical analysis conducted on geographies consisting of 165,778,985 people shows a weak positive correlation between the proportion of Basques and percentage of population with a disability in the United States with a correlation coefficient (R) of 0.205 and weighted average of 12.2%, a difference of 5.8%.
Disability Correlation Summary
| Measurement | Immigrants from Norway | Basque |
| Minimum | 2.2% | 1.7% |
| Maximum | 53.4% | 50.0% |
| Range | 51.2% | 48.3% |
| Mean | 15.4% | 14.2% |
| Median | 12.6% | 13.3% |
| Interquartile 25% (IQ1) | 10.0% | 11.7% |
| Interquartile 75% (IQ3) | 18.9% | 15.8% |
| Interquartile Range (IQR) | 8.9% | 4.1% |
| Standard Deviation (Sample) | 10.3% | 6.6% |
| Standard Deviation (Population) | 10.1% | 6.6% |
Similar Demographics by Disability
Demographics Similar to Immigrants from Norway by Disability
In terms of disability, the demographic groups most similar to Immigrants from Norway are Romanian (11.6%, a difference of 0.030%), Immigrants from Kenya (11.6%, a difference of 0.060%), Immigrants from Moldova (11.6%, a difference of 0.060%), Immigrants from Ghana (11.6%, a difference of 0.11%), and Immigrants from Guatemala (11.6%, a difference of 0.11%).
| Demographics | Rating | Rank | Disability |
| Immigrants | Sudan | 85.3 /100 | #142 | Excellent 11.5% |
| Moroccans | 83.3 /100 | #143 | Excellent 11.5% |
| Australians | 82.5 /100 | #144 | Excellent 11.5% |
| Nigerians | 81.3 /100 | #145 | Excellent 11.5% |
| Immigrants | Hungary | 79.0 /100 | #146 | Good 11.5% |
| Immigrants | Ukraine | 77.6 /100 | #147 | Good 11.5% |
| Sudanese | 77.1 /100 | #148 | Good 11.5% |
| Immigrants | Norway | 73.2 /100 | #149 | Good 11.6% |
| Romanians | 72.7 /100 | #150 | Good 11.6% |
| Immigrants | Kenya | 72.1 /100 | #151 | Good 11.6% |
| Immigrants | Moldova | 72.0 /100 | #152 | Good 11.6% |
| Immigrants | Ghana | 71.2 /100 | #153 | Good 11.6% |
| Immigrants | Guatemala | 71.1 /100 | #154 | Good 11.6% |
| Immigrants | Netherlands | 69.8 /100 | #155 | Good 11.6% |
| Immigrants | Fiji | 69.5 /100 | #156 | Good 11.6% |
Demographics Similar to Basques by Disability
In terms of disability, the demographic groups most similar to Basques are British (12.2%, a difference of 0.0%), Liberian (12.2%, a difference of 0.020%), Swiss (12.2%, a difference of 0.040%), Indonesian (12.2%, a difference of 0.070%), and Polish (12.2%, a difference of 0.090%).
| Demographics | Rating | Rank | Disability |
| Immigrants | Congo | 1.9 /100 | #237 | Tragic 12.2% |
| Norwegians | 1.9 /100 | #238 | Tragic 12.2% |
| Swedes | 1.8 /100 | #239 | Tragic 12.2% |
| Hungarians | 1.7 /100 | #240 | Tragic 12.2% |
| Yugoslavians | 1.7 /100 | #241 | Tragic 12.2% |
| Poles | 1.7 /100 | #242 | Tragic 12.2% |
| British | 1.5 /100 | #243 | Tragic 12.2% |
| Basques | 1.5 /100 | #244 | Tragic 12.2% |
| Liberians | 1.5 /100 | #245 | Tragic 12.2% |
| Swiss | 1.5 /100 | #246 | Tragic 12.2% |
| Indonesians | 1.4 /100 | #247 | Tragic 12.2% |
| Guamanians/Chamorros | 1.4 /100 | #248 | Tragic 12.3% |
| Carpatho Rusyns | 1.4 /100 | #249 | Tragic 12.3% |
| Sub-Saharan Africans | 1.4 /100 | #250 | Tragic 12.3% |
| Europeans | 1.4 /100 | #251 | Tragic 12.3% |