Immigrants from Norway vs Immigrants from Central America Disability
COMPARE
Immigrants from Norway
Immigrants from Central America
Disability
Disability Comparison
Immigrants from Norway
Immigrants from Central America
11.6%
DISABILITY
73.2/ 100
METRIC RATING
149th/ 347
METRIC RANK
11.7%
DISABILITY
46.6/ 100
METRIC RATING
177th/ 347
METRIC RANK
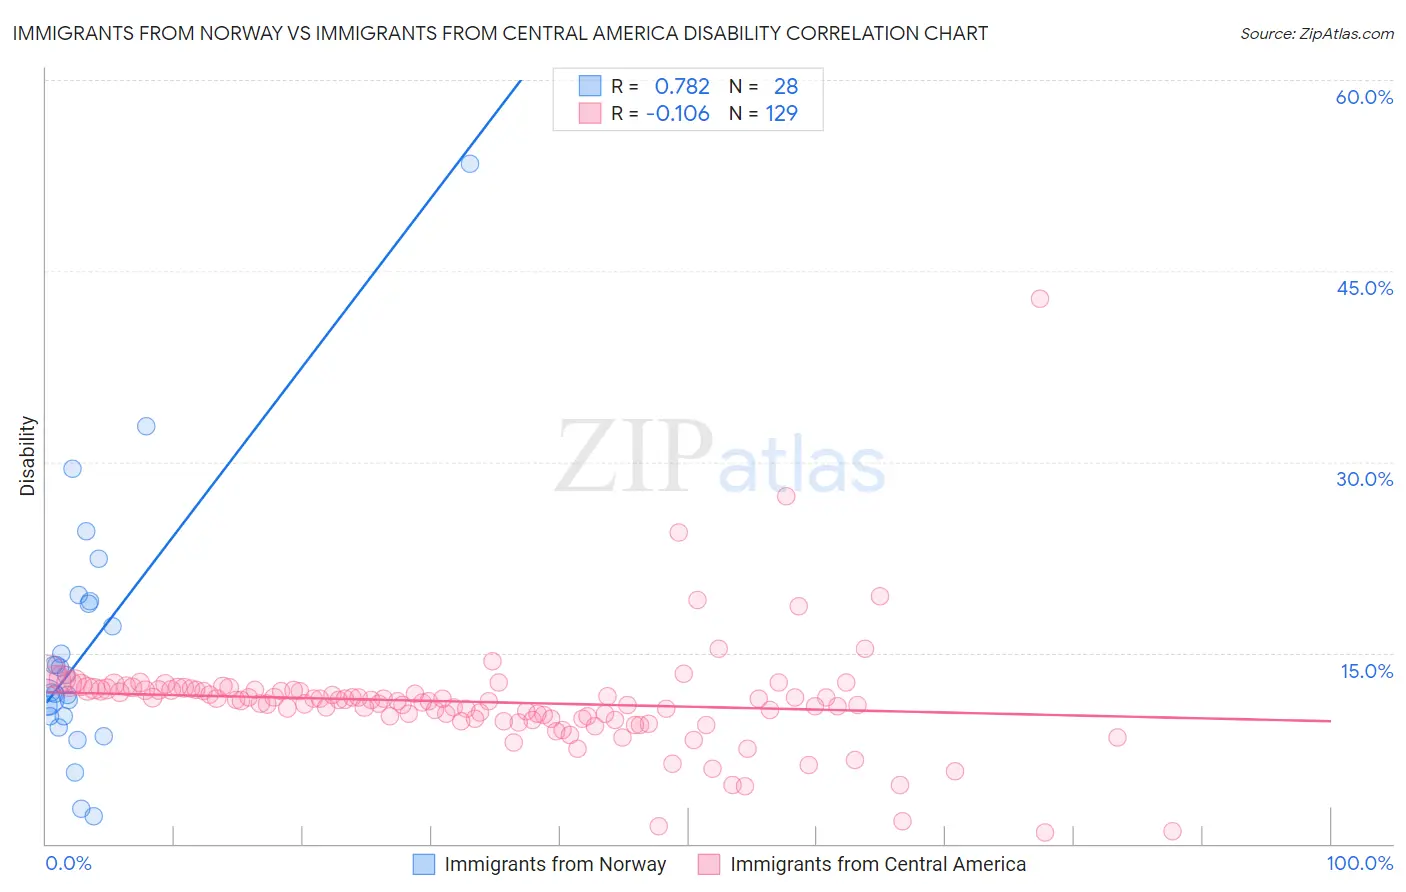
Immigrants from Norway vs Immigrants from Central America Disability Correlation Chart
The statistical analysis conducted on geographies consisting of 116,706,473 people shows a strong positive correlation between the proportion of Immigrants from Norway and percentage of population with a disability in the United States with a correlation coefficient (R) of 0.782 and weighted average of 11.6%. Similarly, the statistical analysis conducted on geographies consisting of 536,390,907 people shows a poor negative correlation between the proportion of Immigrants from Central America and percentage of population with a disability in the United States with a correlation coefficient (R) of -0.106 and weighted average of 11.7%, a difference of 1.3%.
Disability Correlation Summary
| Measurement | Immigrants from Norway | Immigrants from Central America |
| Minimum | 2.2% | 0.89% |
| Maximum | 53.4% | 42.9% |
| Range | 51.2% | 42.0% |
| Mean | 15.4% | 11.1% |
| Median | 12.6% | 11.3% |
| Interquartile 25% (IQ1) | 10.0% | 9.8% |
| Interquartile 75% (IQ3) | 18.9% | 12.1% |
| Interquartile Range (IQR) | 8.9% | 2.3% |
| Standard Deviation (Sample) | 10.3% | 4.4% |
| Standard Deviation (Population) | 10.1% | 4.4% |
Similar Demographics by Disability
Demographics Similar to Immigrants from Norway by Disability
In terms of disability, the demographic groups most similar to Immigrants from Norway are Romanian (11.6%, a difference of 0.030%), Immigrants from Kenya (11.6%, a difference of 0.060%), Immigrants from Moldova (11.6%, a difference of 0.060%), Immigrants from Ghana (11.6%, a difference of 0.11%), and Immigrants from Guatemala (11.6%, a difference of 0.11%).
| Demographics | Rating | Rank | Disability |
| Immigrants | Sudan | 85.3 /100 | #142 | Excellent 11.5% |
| Moroccans | 83.3 /100 | #143 | Excellent 11.5% |
| Australians | 82.5 /100 | #144 | Excellent 11.5% |
| Nigerians | 81.3 /100 | #145 | Excellent 11.5% |
| Immigrants | Hungary | 79.0 /100 | #146 | Good 11.5% |
| Immigrants | Ukraine | 77.6 /100 | #147 | Good 11.5% |
| Sudanese | 77.1 /100 | #148 | Good 11.5% |
| Immigrants | Norway | 73.2 /100 | #149 | Good 11.6% |
| Romanians | 72.7 /100 | #150 | Good 11.6% |
| Immigrants | Kenya | 72.1 /100 | #151 | Good 11.6% |
| Immigrants | Moldova | 72.0 /100 | #152 | Good 11.6% |
| Immigrants | Ghana | 71.2 /100 | #153 | Good 11.6% |
| Immigrants | Guatemala | 71.1 /100 | #154 | Good 11.6% |
| Immigrants | Netherlands | 69.8 /100 | #155 | Good 11.6% |
| Immigrants | Fiji | 69.5 /100 | #156 | Good 11.6% |
Demographics Similar to Immigrants from Central America by Disability
In terms of disability, the demographic groups most similar to Immigrants from Central America are Greek (11.7%, a difference of 0.020%), Immigrants from Western Africa (11.7%, a difference of 0.040%), Haitian (11.7%, a difference of 0.090%), Albanian (11.7%, a difference of 0.15%), and Maltese (11.7%, a difference of 0.18%).
| Demographics | Rating | Rank | Disability |
| Immigrants | Albania | 52.8 /100 | #170 | Average 11.7% |
| Immigrants | Southern Europe | 52.8 /100 | #171 | Average 11.7% |
| Trinidadians and Tobagonians | 52.7 /100 | #172 | Average 11.7% |
| Maltese | 50.6 /100 | #173 | Average 11.7% |
| Albanians | 50.0 /100 | #174 | Average 11.7% |
| Haitians | 48.6 /100 | #175 | Average 11.7% |
| Immigrants | Western Africa | 47.5 /100 | #176 | Average 11.7% |
| Immigrants | Central America | 46.6 /100 | #177 | Average 11.7% |
| Greeks | 46.2 /100 | #178 | Average 11.7% |
| Immigrants | Armenia | 41.9 /100 | #179 | Average 11.7% |
| Immigrants | Honduras | 37.8 /100 | #180 | Fair 11.8% |
| Immigrants | Oceania | 34.3 /100 | #181 | Fair 11.8% |
| Icelanders | 34.0 /100 | #182 | Fair 11.8% |
| Hondurans | 31.2 /100 | #183 | Fair 11.8% |
| Iraqis | 30.0 /100 | #184 | Fair 11.8% |