Immigrants from Norway vs Immigrants from Chile Disability
COMPARE
Immigrants from Norway
Immigrants from Chile
Disability
Disability Comparison
Immigrants from Norway
Immigrants from Chile
11.6%
DISABILITY
73.2/ 100
METRIC RATING
149th/ 347
METRIC RANK
11.0%
DISABILITY
99.4/ 100
METRIC RATING
72nd/ 347
METRIC RANK
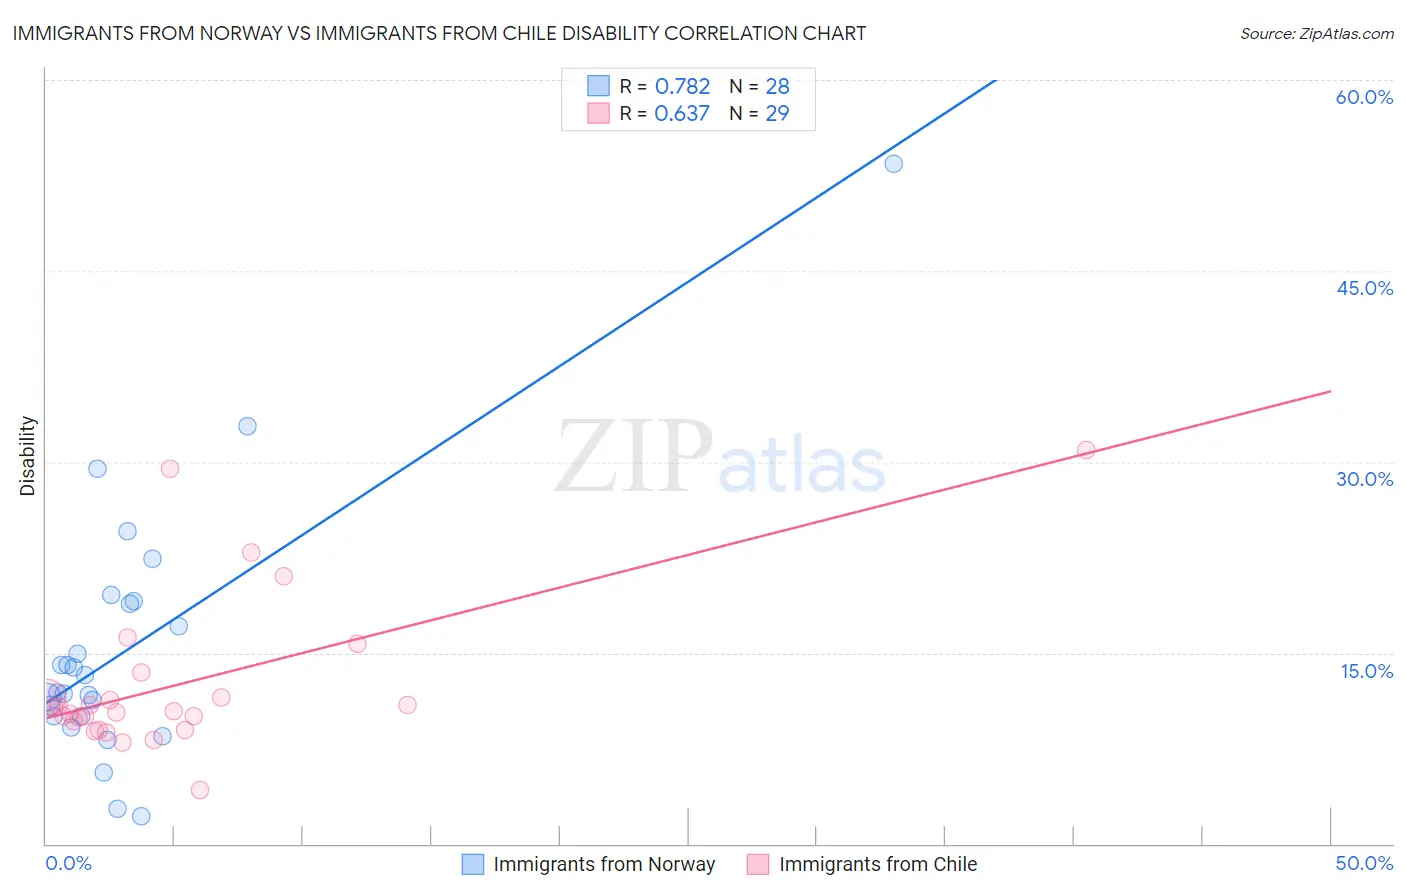
Immigrants from Norway vs Immigrants from Chile Disability Correlation Chart
The statistical analysis conducted on geographies consisting of 116,706,473 people shows a strong positive correlation between the proportion of Immigrants from Norway and percentage of population with a disability in the United States with a correlation coefficient (R) of 0.782 and weighted average of 11.6%. Similarly, the statistical analysis conducted on geographies consisting of 218,638,436 people shows a significant positive correlation between the proportion of Immigrants from Chile and percentage of population with a disability in the United States with a correlation coefficient (R) of 0.637 and weighted average of 11.0%, a difference of 4.8%.
Disability Correlation Summary
| Measurement | Immigrants from Norway | Immigrants from Chile |
| Minimum | 2.2% | 4.2% |
| Maximum | 53.4% | 31.0% |
| Range | 51.2% | 26.8% |
| Mean | 15.4% | 12.5% |
| Median | 12.6% | 10.4% |
| Interquartile 25% (IQ1) | 10.0% | 9.3% |
| Interquartile 75% (IQ3) | 18.9% | 12.5% |
| Interquartile Range (IQR) | 8.9% | 3.2% |
| Standard Deviation (Sample) | 10.3% | 6.1% |
| Standard Deviation (Population) | 10.1% | 6.0% |
Similar Demographics by Disability
Demographics Similar to Immigrants from Norway by Disability
In terms of disability, the demographic groups most similar to Immigrants from Norway are Romanian (11.6%, a difference of 0.030%), Immigrants from Kenya (11.6%, a difference of 0.060%), Immigrants from Moldova (11.6%, a difference of 0.060%), Immigrants from Ghana (11.6%, a difference of 0.11%), and Immigrants from Guatemala (11.6%, a difference of 0.11%).
| Demographics | Rating | Rank | Disability |
| Immigrants | Sudan | 85.3 /100 | #142 | Excellent 11.5% |
| Moroccans | 83.3 /100 | #143 | Excellent 11.5% |
| Australians | 82.5 /100 | #144 | Excellent 11.5% |
| Nigerians | 81.3 /100 | #145 | Excellent 11.5% |
| Immigrants | Hungary | 79.0 /100 | #146 | Good 11.5% |
| Immigrants | Ukraine | 77.6 /100 | #147 | Good 11.5% |
| Sudanese | 77.1 /100 | #148 | Good 11.5% |
| Immigrants | Norway | 73.2 /100 | #149 | Good 11.6% |
| Romanians | 72.7 /100 | #150 | Good 11.6% |
| Immigrants | Kenya | 72.1 /100 | #151 | Good 11.6% |
| Immigrants | Moldova | 72.0 /100 | #152 | Good 11.6% |
| Immigrants | Ghana | 71.2 /100 | #153 | Good 11.6% |
| Immigrants | Guatemala | 71.1 /100 | #154 | Good 11.6% |
| Immigrants | Netherlands | 69.8 /100 | #155 | Good 11.6% |
| Immigrants | Fiji | 69.5 /100 | #156 | Good 11.6% |
Demographics Similar to Immigrants from Chile by Disability
In terms of disability, the demographic groups most similar to Immigrants from Chile are Immigrants from Bangladesh (11.0%, a difference of 0.030%), Immigrants from Serbia (11.0%, a difference of 0.040%), Immigrants from Vietnam (11.0%, a difference of 0.070%), Immigrants from Lebanon (11.0%, a difference of 0.090%), and Sierra Leonean (11.0%, a difference of 0.090%).
| Demographics | Rating | Rank | Disability |
| Bulgarians | 99.6 /100 | #65 | Exceptional 11.0% |
| Laotians | 99.6 /100 | #66 | Exceptional 11.0% |
| Colombians | 99.6 /100 | #67 | Exceptional 11.0% |
| Immigrants | Afghanistan | 99.6 /100 | #68 | Exceptional 11.0% |
| Sri Lankans | 99.5 /100 | #69 | Exceptional 11.0% |
| Immigrants | France | 99.4 /100 | #70 | Exceptional 11.0% |
| Immigrants | Lebanon | 99.4 /100 | #71 | Exceptional 11.0% |
| Immigrants | Chile | 99.4 /100 | #72 | Exceptional 11.0% |
| Immigrants | Bangladesh | 99.4 /100 | #73 | Exceptional 11.0% |
| Immigrants | Serbia | 99.4 /100 | #74 | Exceptional 11.0% |
| Immigrants | Vietnam | 99.4 /100 | #75 | Exceptional 11.0% |
| Sierra Leoneans | 99.3 /100 | #76 | Exceptional 11.0% |
| Immigrants | Belgium | 99.3 /100 | #77 | Exceptional 11.0% |
| Immigrants | Cameroon | 99.3 /100 | #78 | Exceptional 11.1% |
| Immigrants | Jordan | 99.3 /100 | #79 | Exceptional 11.1% |