Immigrants from Norway vs Cajun Disability
COMPARE
Immigrants from Norway
Cajun
Disability
Disability Comparison
Immigrants from Norway
Cajuns
11.6%
DISABILITY
73.2/ 100
METRIC RATING
149th/ 347
METRIC RANK
14.6%
DISABILITY
0.0/ 100
METRIC RATING
333rd/ 347
METRIC RANK
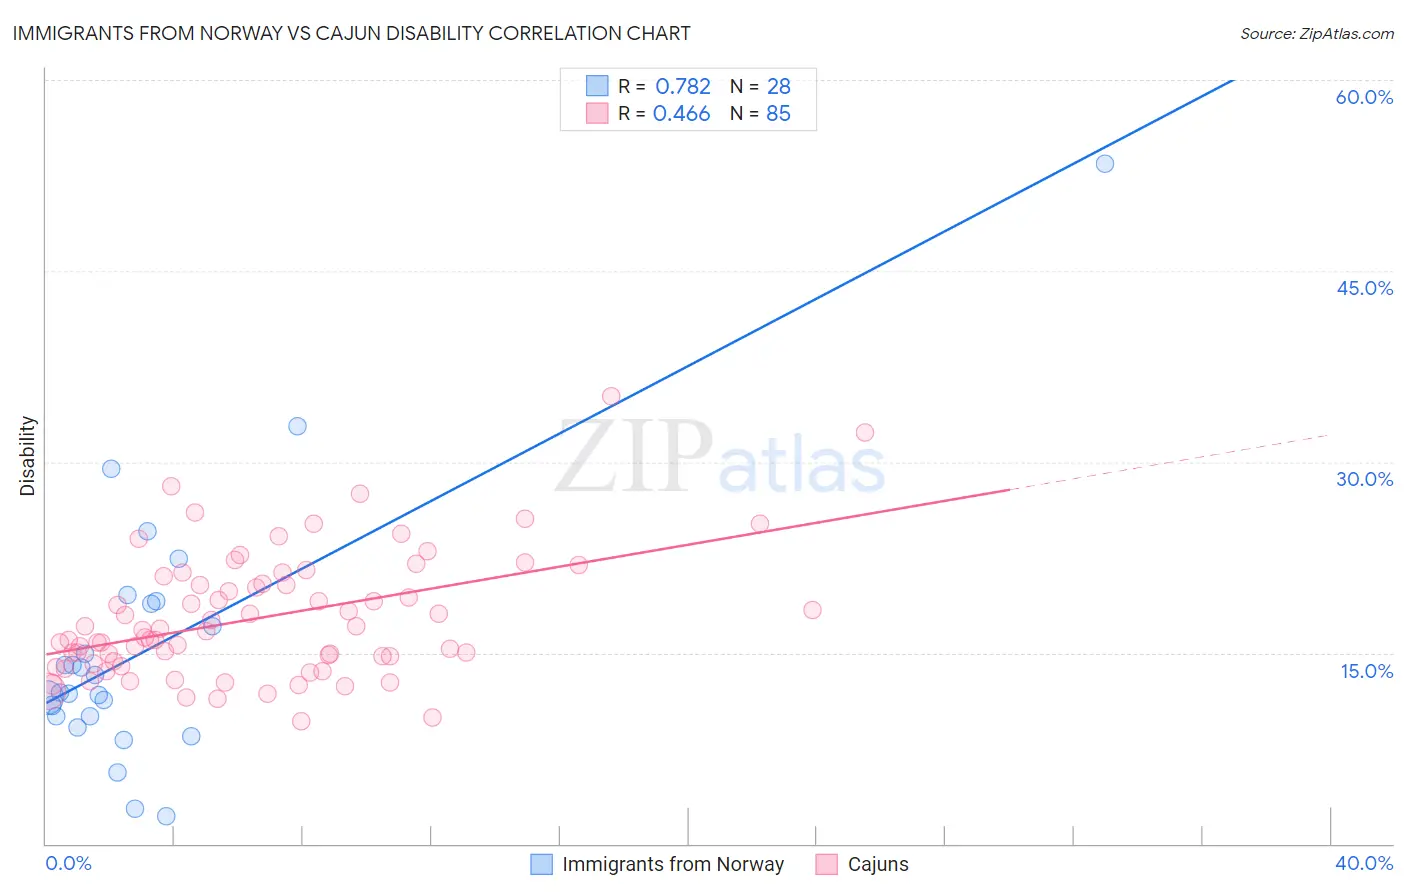
Immigrants from Norway vs Cajun Disability Correlation Chart
The statistical analysis conducted on geographies consisting of 116,706,473 people shows a strong positive correlation between the proportion of Immigrants from Norway and percentage of population with a disability in the United States with a correlation coefficient (R) of 0.782 and weighted average of 11.6%. Similarly, the statistical analysis conducted on geographies consisting of 149,702,868 people shows a moderate positive correlation between the proportion of Cajuns and percentage of population with a disability in the United States with a correlation coefficient (R) of 0.466 and weighted average of 14.6%, a difference of 26.2%.
Disability Correlation Summary
| Measurement | Immigrants from Norway | Cajun |
| Minimum | 2.2% | 9.6% |
| Maximum | 53.4% | 35.2% |
| Range | 51.2% | 25.5% |
| Mean | 15.4% | 17.8% |
| Median | 12.6% | 16.7% |
| Interquartile 25% (IQ1) | 10.0% | 14.3% |
| Interquartile 75% (IQ3) | 18.9% | 20.7% |
| Interquartile Range (IQR) | 8.9% | 6.5% |
| Standard Deviation (Sample) | 10.3% | 4.9% |
| Standard Deviation (Population) | 10.1% | 4.9% |
Similar Demographics by Disability
Demographics Similar to Immigrants from Norway by Disability
In terms of disability, the demographic groups most similar to Immigrants from Norway are Romanian (11.6%, a difference of 0.030%), Immigrants from Kenya (11.6%, a difference of 0.060%), Immigrants from Moldova (11.6%, a difference of 0.060%), Immigrants from Ghana (11.6%, a difference of 0.11%), and Immigrants from Guatemala (11.6%, a difference of 0.11%).
| Demographics | Rating | Rank | Disability |
| Immigrants | Sudan | 85.3 /100 | #142 | Excellent 11.5% |
| Moroccans | 83.3 /100 | #143 | Excellent 11.5% |
| Australians | 82.5 /100 | #144 | Excellent 11.5% |
| Nigerians | 81.3 /100 | #145 | Excellent 11.5% |
| Immigrants | Hungary | 79.0 /100 | #146 | Good 11.5% |
| Immigrants | Ukraine | 77.6 /100 | #147 | Good 11.5% |
| Sudanese | 77.1 /100 | #148 | Good 11.5% |
| Immigrants | Norway | 73.2 /100 | #149 | Good 11.6% |
| Romanians | 72.7 /100 | #150 | Good 11.6% |
| Immigrants | Kenya | 72.1 /100 | #151 | Good 11.6% |
| Immigrants | Moldova | 72.0 /100 | #152 | Good 11.6% |
| Immigrants | Ghana | 71.2 /100 | #153 | Good 11.6% |
| Immigrants | Guatemala | 71.1 /100 | #154 | Good 11.6% |
| Immigrants | Netherlands | 69.8 /100 | #155 | Good 11.6% |
| Immigrants | Fiji | 69.5 /100 | #156 | Good 11.6% |
Demographics Similar to Cajuns by Disability
In terms of disability, the demographic groups most similar to Cajuns are Yuman (14.6%, a difference of 0.12%), Pueblo (14.4%, a difference of 1.1%), Alaskan Athabascan (14.4%, a difference of 1.1%), Tohono O'odham (14.8%, a difference of 1.2%), and Cherokee (14.8%, a difference of 1.7%).
| Demographics | Rating | Rank | Disability |
| Osage | 0.0 /100 | #326 | Tragic 14.2% |
| Ottawa | 0.0 /100 | #327 | Tragic 14.2% |
| Immigrants | Azores | 0.0 /100 | #328 | Tragic 14.2% |
| Potawatomi | 0.0 /100 | #329 | Tragic 14.2% |
| Navajo | 0.0 /100 | #330 | Tragic 14.3% |
| Alaskan Athabascans | 0.0 /100 | #331 | Tragic 14.4% |
| Pueblo | 0.0 /100 | #332 | Tragic 14.4% |
| Cajuns | 0.0 /100 | #333 | Tragic 14.6% |
| Yuman | 0.0 /100 | #334 | Tragic 14.6% |
| Tohono O'odham | 0.0 /100 | #335 | Tragic 14.8% |
| Cherokee | 0.0 /100 | #336 | Tragic 14.8% |
| Seminole | 0.0 /100 | #337 | Tragic 14.9% |
| Dutch West Indians | 0.0 /100 | #338 | Tragic 14.9% |
| Chickasaw | 0.0 /100 | #339 | Tragic 15.2% |
| Choctaw | 0.0 /100 | #340 | Tragic 15.4% |