Nepalese vs Basque Disability
COMPARE
Nepalese
Basque
Disability
Disability Comparison
Nepalese
Basques
12.8%
DISABILITY
0.0/ 100
METRIC RATING
274th/ 347
METRIC RANK
12.2%
DISABILITY
1.5/ 100
METRIC RATING
244th/ 347
METRIC RANK
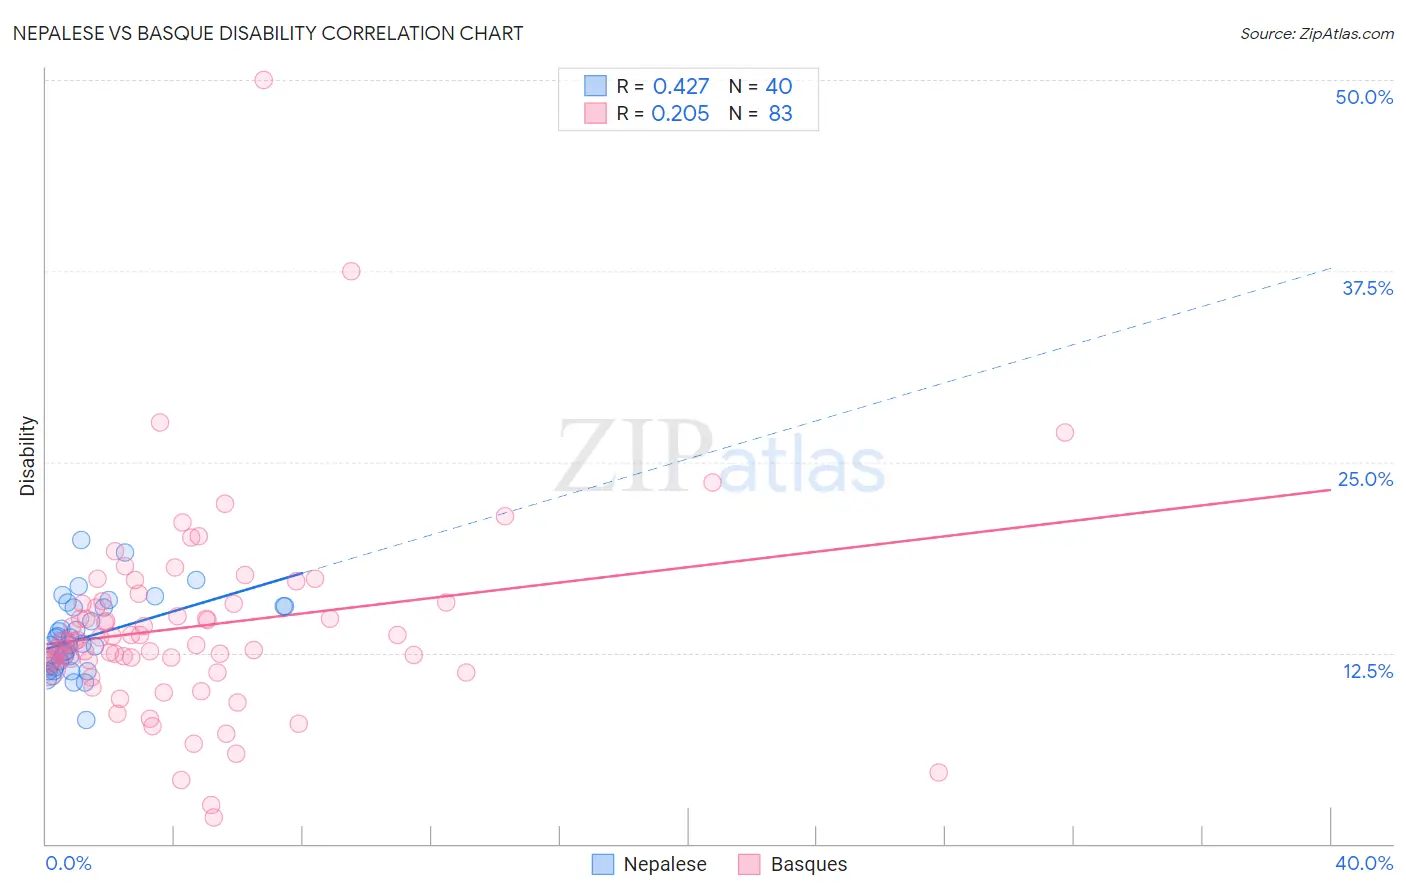
Nepalese vs Basque Disability Correlation Chart
The statistical analysis conducted on geographies consisting of 24,521,755 people shows a moderate positive correlation between the proportion of Nepalese and percentage of population with a disability in the United States with a correlation coefficient (R) of 0.427 and weighted average of 12.8%. Similarly, the statistical analysis conducted on geographies consisting of 165,778,985 people shows a weak positive correlation between the proportion of Basques and percentage of population with a disability in the United States with a correlation coefficient (R) of 0.205 and weighted average of 12.2%, a difference of 4.3%.
Disability Correlation Summary
| Measurement | Nepalese | Basque |
| Minimum | 8.1% | 1.7% |
| Maximum | 19.9% | 50.0% |
| Range | 11.8% | 48.3% |
| Mean | 13.5% | 14.2% |
| Median | 13.1% | 13.3% |
| Interquartile 25% (IQ1) | 11.6% | 11.7% |
| Interquartile 75% (IQ3) | 15.5% | 15.8% |
| Interquartile Range (IQR) | 3.9% | 4.1% |
| Standard Deviation (Sample) | 2.5% | 6.6% |
| Standard Deviation (Population) | 2.4% | 6.6% |
Similar Demographics by Disability
Demographics Similar to Nepalese by Disability
In terms of disability, the demographic groups most similar to Nepalese are Sioux (12.8%, a difference of 0.080%), Hmong (12.8%, a difference of 0.23%), Dutch (12.8%, a difference of 0.28%), Finnish (12.7%, a difference of 0.43%), and German (12.8%, a difference of 0.45%).
| Demographics | Rating | Rank | Disability |
| Spaniards | 0.2 /100 | #267 | Tragic 12.5% |
| Bangladeshis | 0.1 /100 | #268 | Tragic 12.6% |
| Immigrants | Dominican Republic | 0.1 /100 | #269 | Tragic 12.6% |
| Portuguese | 0.1 /100 | #270 | Tragic 12.6% |
| Immigrants | Yemen | 0.1 /100 | #271 | Tragic 12.6% |
| Dominicans | 0.0 /100 | #272 | Tragic 12.7% |
| Finns | 0.0 /100 | #273 | Tragic 12.7% |
| Nepalese | 0.0 /100 | #274 | Tragic 12.8% |
| Sioux | 0.0 /100 | #275 | Tragic 12.8% |
| Hmong | 0.0 /100 | #276 | Tragic 12.8% |
| Dutch | 0.0 /100 | #277 | Tragic 12.8% |
| Germans | 0.0 /100 | #278 | Tragic 12.8% |
| Fijians | 0.0 /100 | #279 | Tragic 12.8% |
| Spanish | 0.0 /100 | #280 | Tragic 12.8% |
| Immigrants | Portugal | 0.0 /100 | #281 | Tragic 12.9% |
Demographics Similar to Basques by Disability
In terms of disability, the demographic groups most similar to Basques are British (12.2%, a difference of 0.0%), Liberian (12.2%, a difference of 0.020%), Swiss (12.2%, a difference of 0.040%), Indonesian (12.2%, a difference of 0.070%), and Polish (12.2%, a difference of 0.090%).
| Demographics | Rating | Rank | Disability |
| Immigrants | Congo | 1.9 /100 | #237 | Tragic 12.2% |
| Norwegians | 1.9 /100 | #238 | Tragic 12.2% |
| Swedes | 1.8 /100 | #239 | Tragic 12.2% |
| Hungarians | 1.7 /100 | #240 | Tragic 12.2% |
| Yugoslavians | 1.7 /100 | #241 | Tragic 12.2% |
| Poles | 1.7 /100 | #242 | Tragic 12.2% |
| British | 1.5 /100 | #243 | Tragic 12.2% |
| Basques | 1.5 /100 | #244 | Tragic 12.2% |
| Liberians | 1.5 /100 | #245 | Tragic 12.2% |
| Swiss | 1.5 /100 | #246 | Tragic 12.2% |
| Indonesians | 1.4 /100 | #247 | Tragic 12.2% |
| Guamanians/Chamorros | 1.4 /100 | #248 | Tragic 12.3% |
| Carpatho Rusyns | 1.4 /100 | #249 | Tragic 12.3% |
| Sub-Saharan Africans | 1.4 /100 | #250 | Tragic 12.3% |
| Europeans | 1.4 /100 | #251 | Tragic 12.3% |