Immigrants from Norway vs Basque Single Female Poverty
COMPARE
Immigrants from Norway
Basque
Single Female Poverty
Single Female Poverty Comparison
Immigrants from Norway
Basques
20.8%
SINGLE FEMALE POVERTY
63.0/ 100
METRIC RATING
167th/ 347
METRIC RANK
21.3%
SINGLE FEMALE POVERTY
28.1/ 100
METRIC RATING
193rd/ 347
METRIC RANK
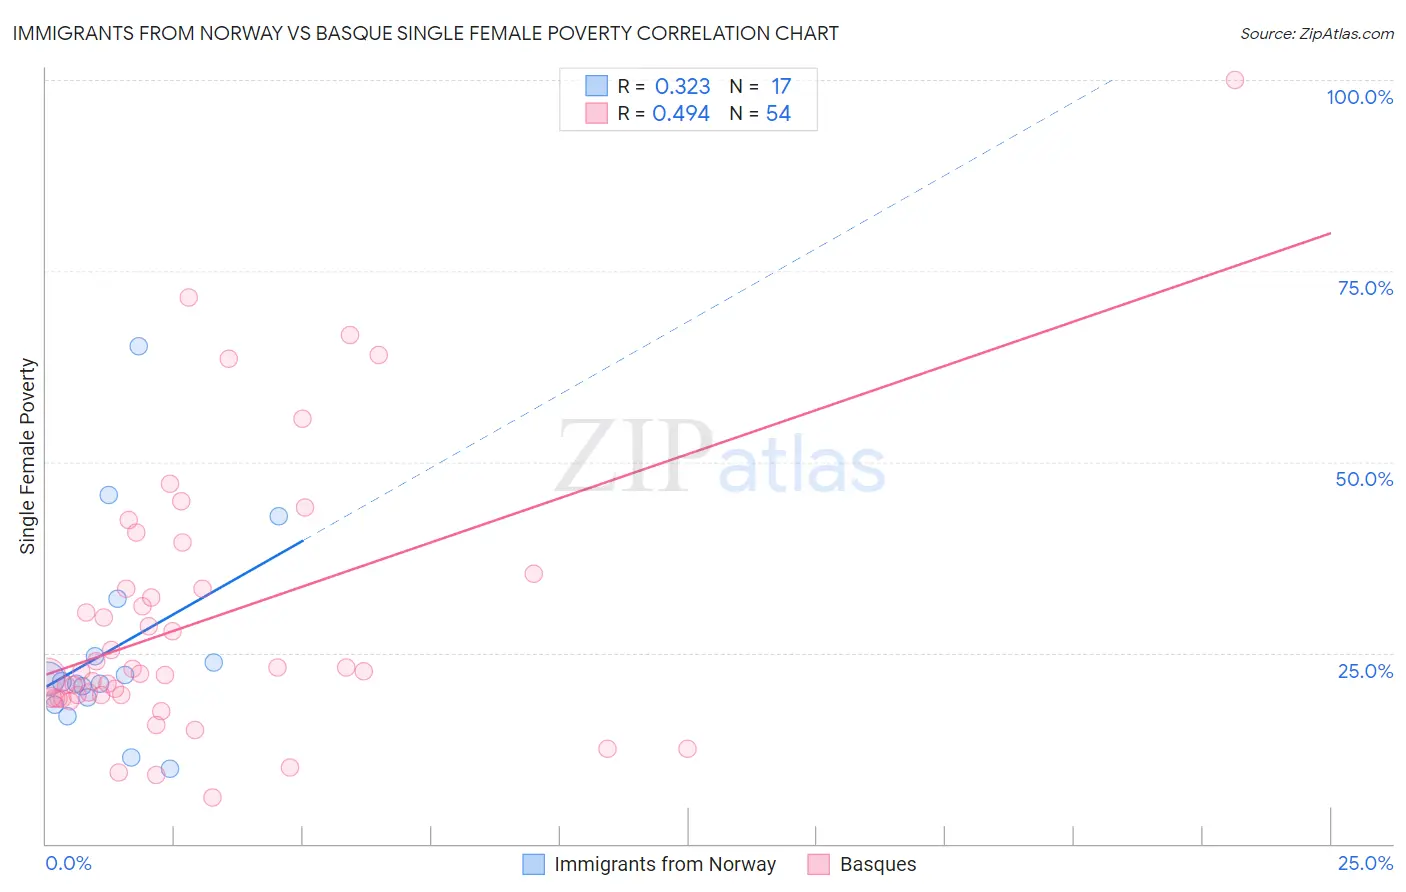
Immigrants from Norway vs Basque Single Female Poverty Correlation Chart
The statistical analysis conducted on geographies consisting of 115,651,083 people shows a mild positive correlation between the proportion of Immigrants from Norway and poverty level among single females in the United States with a correlation coefficient (R) of 0.323 and weighted average of 20.8%. Similarly, the statistical analysis conducted on geographies consisting of 164,728,632 people shows a moderate positive correlation between the proportion of Basques and poverty level among single females in the United States with a correlation coefficient (R) of 0.494 and weighted average of 21.3%, a difference of 2.3%.
Single Female Poverty Correlation Summary
| Measurement | Immigrants from Norway | Basque |
| Minimum | 9.8% | 6.1% |
| Maximum | 65.2% | 100.0% |
| Range | 55.4% | 93.9% |
| Mean | 25.7% | 29.2% |
| Median | 21.2% | 22.6% |
| Interquartile 25% (IQ1) | 18.7% | 19.2% |
| Interquartile 75% (IQ3) | 28.3% | 33.4% |
| Interquartile Range (IQR) | 9.6% | 14.2% |
| Standard Deviation (Sample) | 13.8% | 17.9% |
| Standard Deviation (Population) | 13.4% | 17.8% |
Similar Demographics by Single Female Poverty
Demographics Similar to Immigrants from Norway by Single Female Poverty
In terms of single female poverty, the demographic groups most similar to Immigrants from Norway are Norwegian (20.8%, a difference of 0.0%), Ugandan (20.8%, a difference of 0.070%), Immigrants from Costa Rica (20.9%, a difference of 0.090%), Iraqi (20.8%, a difference of 0.10%), and Lebanese (20.8%, a difference of 0.32%).
| Demographics | Rating | Rank | Single Female Poverty |
| Arabs | 70.8 /100 | #160 | Good 20.7% |
| Kenyans | 68.5 /100 | #161 | Good 20.8% |
| Northern Europeans | 68.4 /100 | #162 | Good 20.8% |
| Lebanese | 67.6 /100 | #163 | Good 20.8% |
| Iraqis | 64.5 /100 | #164 | Good 20.8% |
| Ugandans | 64.0 /100 | #165 | Good 20.8% |
| Norwegians | 63.0 /100 | #166 | Good 20.8% |
| Immigrants | Norway | 63.0 /100 | #167 | Good 20.8% |
| Immigrants | Costa Rica | 61.5 /100 | #168 | Good 20.9% |
| Immigrants | Trinidad and Tobago | 56.3 /100 | #169 | Average 20.9% |
| New Zealanders | 53.2 /100 | #170 | Average 21.0% |
| Moroccans | 52.8 /100 | #171 | Average 21.0% |
| Guyanese | 52.0 /100 | #172 | Average 21.0% |
| Immigrants | Guyana | 50.6 /100 | #173 | Average 21.0% |
| Cubans | 50.0 /100 | #174 | Average 21.0% |
Demographics Similar to Basques by Single Female Poverty
In terms of single female poverty, the demographic groups most similar to Basques are Czechoslovakian (21.3%, a difference of 0.030%), Nicaraguan (21.3%, a difference of 0.040%), Immigrants from Saudi Arabia (21.3%, a difference of 0.070%), Japanese (21.3%, a difference of 0.13%), and Immigrants from Jamaica (21.3%, a difference of 0.18%).
| Demographics | Rating | Rank | Single Female Poverty |
| Hawaiians | 37.7 /100 | #186 | Fair 21.2% |
| Immigrants | Nigeria | 36.8 /100 | #187 | Fair 21.2% |
| Yugoslavians | 35.4 /100 | #188 | Fair 21.2% |
| Immigrants | Cuba | 35.3 /100 | #189 | Fair 21.2% |
| Trinidadians and Tobagonians | 35.2 /100 | #190 | Fair 21.2% |
| Immigrants | Germany | 31.1 /100 | #191 | Fair 21.3% |
| Immigrants | Jamaica | 30.5 /100 | #192 | Fair 21.3% |
| Basques | 28.1 /100 | #193 | Fair 21.3% |
| Czechoslovakians | 27.7 /100 | #194 | Fair 21.3% |
| Nicaraguans | 27.6 /100 | #195 | Fair 21.3% |
| Immigrants | Saudi Arabia | 27.1 /100 | #196 | Fair 21.3% |
| Japanese | 26.4 /100 | #197 | Fair 21.3% |
| Swiss | 24.2 /100 | #198 | Fair 21.4% |
| Immigrants | Immigrants | 22.0 /100 | #199 | Fair 21.4% |
| Irish | 21.4 /100 | #200 | Fair 21.4% |