Immigrants from Norway vs Basque Bachelor's Degree
COMPARE
Immigrants from Norway
Basque
Bachelor's Degree
Bachelor's Degree Comparison
Immigrants from Norway
Basques
44.5%
BACHELOR'S DEGREE
99.9/ 100
METRIC RATING
49th/ 347
METRIC RANK
37.7%
BACHELOR'S DEGREE
47.4/ 100
METRIC RATING
177th/ 347
METRIC RANK
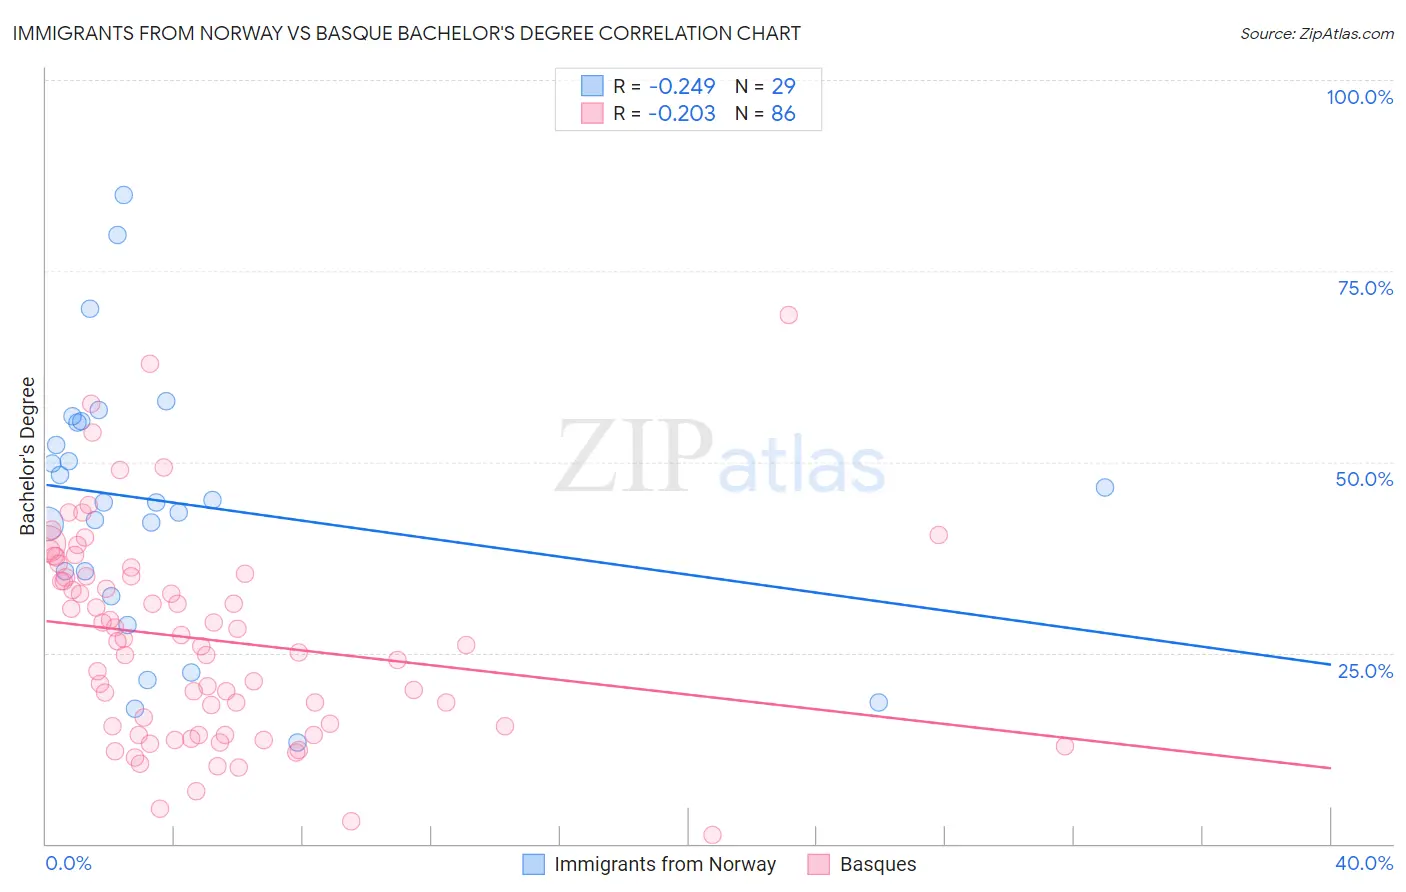
Immigrants from Norway vs Basque Bachelor's Degree Correlation Chart
The statistical analysis conducted on geographies consisting of 116,713,560 people shows a weak negative correlation between the proportion of Immigrants from Norway and percentage of population with at least bachelor's degree education in the United States with a correlation coefficient (R) of -0.249 and weighted average of 44.5%. Similarly, the statistical analysis conducted on geographies consisting of 165,778,138 people shows a weak negative correlation between the proportion of Basques and percentage of population with at least bachelor's degree education in the United States with a correlation coefficient (R) of -0.203 and weighted average of 37.7%, a difference of 18.0%.
Bachelor's Degree Correlation Summary
| Measurement | Immigrants from Norway | Basque |
| Minimum | 13.2% | 1.2% |
| Maximum | 84.9% | 69.2% |
| Range | 71.7% | 68.0% |
| Mean | 44.6% | 26.8% |
| Median | 44.8% | 26.3% |
| Interquartile 25% (IQ1) | 34.0% | 15.4% |
| Interquartile 75% (IQ3) | 55.3% | 35.0% |
| Interquartile Range (IQR) | 21.2% | 19.7% |
| Standard Deviation (Sample) | 17.2% | 13.5% |
| Standard Deviation (Population) | 16.9% | 13.4% |
Similar Demographics by Bachelor's Degree
Demographics Similar to Immigrants from Norway by Bachelor's Degree
In terms of bachelor's degree, the demographic groups most similar to Immigrants from Norway are Bolivian (44.6%, a difference of 0.12%), Estonian (44.6%, a difference of 0.12%), Immigrants from Greece (44.5%, a difference of 0.12%), Immigrants from Bulgaria (44.6%, a difference of 0.16%), and Immigrants from Kuwait (44.6%, a difference of 0.22%).
| Demographics | Rating | Rank | Bachelor's Degree |
| Immigrants | Saudi Arabia | 100.0 /100 | #42 | Exceptional 44.8% |
| Immigrants | South Africa | 99.9 /100 | #43 | Exceptional 44.8% |
| Immigrants | Lithuania | 99.9 /100 | #44 | Exceptional 44.6% |
| Immigrants | Kuwait | 99.9 /100 | #45 | Exceptional 44.6% |
| Immigrants | Bulgaria | 99.9 /100 | #46 | Exceptional 44.6% |
| Bolivians | 99.9 /100 | #47 | Exceptional 44.6% |
| Estonians | 99.9 /100 | #48 | Exceptional 44.6% |
| Immigrants | Norway | 99.9 /100 | #49 | Exceptional 44.5% |
| Immigrants | Greece | 99.9 /100 | #50 | Exceptional 44.5% |
| Asians | 99.9 /100 | #51 | Exceptional 44.4% |
| Immigrants | Spain | 99.9 /100 | #52 | Exceptional 44.3% |
| Immigrants | Asia | 99.9 /100 | #53 | Exceptional 44.3% |
| Immigrants | Austria | 99.9 /100 | #54 | Exceptional 44.2% |
| Immigrants | Bolivia | 99.9 /100 | #55 | Exceptional 44.2% |
| Immigrants | Serbia | 99.9 /100 | #56 | Exceptional 44.1% |
Demographics Similar to Basques by Bachelor's Degree
In terms of bachelor's degree, the demographic groups most similar to Basques are Costa Rican (37.7%, a difference of 0.020%), Immigrants from Cameroon (37.7%, a difference of 0.060%), Immigrants from Uruguay (37.8%, a difference of 0.090%), Immigrants from Colombia (37.7%, a difference of 0.19%), and Immigrants from Bangladesh (37.8%, a difference of 0.25%).
| Demographics | Rating | Rank | Bachelor's Degree |
| Czechs | 54.4 /100 | #170 | Average 38.0% |
| Bermudans | 54.2 /100 | #171 | Average 38.0% |
| Immigrants | Somalia | 52.8 /100 | #172 | Average 37.9% |
| Immigrants | Iraq | 52.5 /100 | #173 | Average 37.9% |
| Immigrants | Bangladesh | 50.0 /100 | #174 | Average 37.8% |
| Immigrants | Uruguay | 48.3 /100 | #175 | Average 37.8% |
| Costa Ricans | 47.6 /100 | #176 | Average 37.7% |
| Basques | 47.4 /100 | #177 | Average 37.7% |
| Immigrants | Cameroon | 46.8 /100 | #178 | Average 37.7% |
| Immigrants | Colombia | 45.4 /100 | #179 | Average 37.7% |
| Irish | 44.3 /100 | #180 | Average 37.6% |
| Immigrants | Senegal | 43.8 /100 | #181 | Average 37.6% |
| Immigrants | Bosnia and Herzegovina | 43.4 /100 | #182 | Average 37.6% |
| Senegalese | 42.2 /100 | #183 | Average 37.5% |
| Scandinavians | 41.7 /100 | #184 | Average 37.5% |