Immigrants from Norway vs Soviet Union Disability
COMPARE
Immigrants from Norway
Soviet Union
Disability
Disability Comparison
Immigrants from Norway
Soviet Union
11.6%
DISABILITY
73.2/ 100
METRIC RATING
149th/ 347
METRIC RANK
10.9%
DISABILITY
99.9/ 100
METRIC RATING
48th/ 347
METRIC RANK
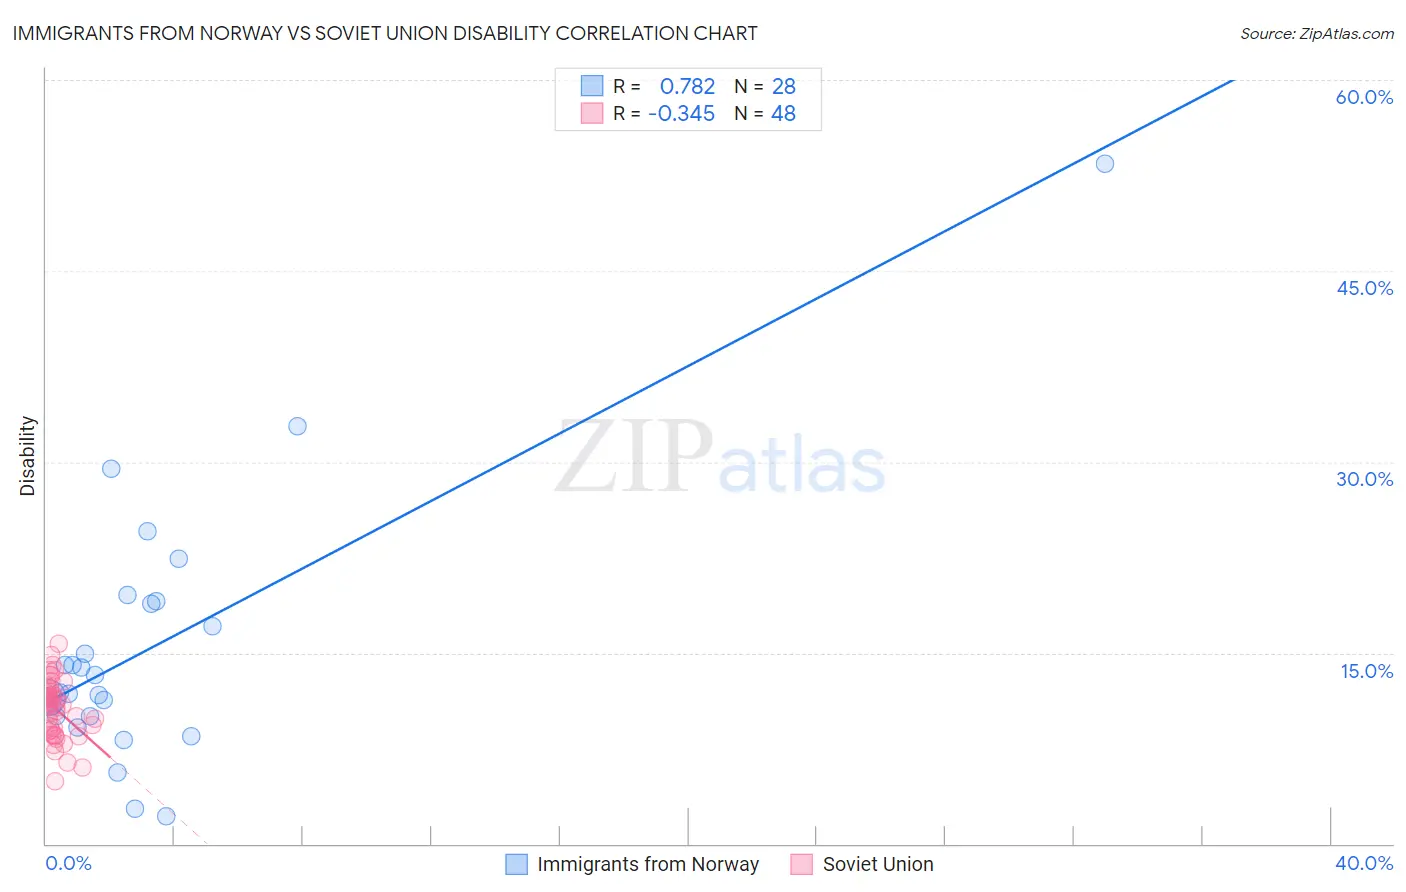
Immigrants from Norway vs Soviet Union Disability Correlation Chart
The statistical analysis conducted on geographies consisting of 116,706,473 people shows a strong positive correlation between the proportion of Immigrants from Norway and percentage of population with a disability in the United States with a correlation coefficient (R) of 0.782 and weighted average of 11.6%. Similarly, the statistical analysis conducted on geographies consisting of 43,487,843 people shows a mild negative correlation between the proportion of Soviet Union and percentage of population with a disability in the United States with a correlation coefficient (R) of -0.345 and weighted average of 10.9%, a difference of 6.6%.
Disability Correlation Summary
| Measurement | Immigrants from Norway | Soviet Union |
| Minimum | 2.2% | 4.9% |
| Maximum | 53.4% | 15.7% |
| Range | 51.2% | 10.8% |
| Mean | 15.4% | 10.6% |
| Median | 12.6% | 10.9% |
| Interquartile 25% (IQ1) | 10.0% | 8.9% |
| Interquartile 75% (IQ3) | 18.9% | 11.8% |
| Interquartile Range (IQR) | 8.9% | 3.0% |
| Standard Deviation (Sample) | 10.3% | 2.3% |
| Standard Deviation (Population) | 10.1% | 2.3% |
Similar Demographics by Disability
Demographics Similar to Immigrants from Norway by Disability
In terms of disability, the demographic groups most similar to Immigrants from Norway are Romanian (11.6%, a difference of 0.030%), Immigrants from Kenya (11.6%, a difference of 0.060%), Immigrants from Moldova (11.6%, a difference of 0.060%), Immigrants from Ghana (11.6%, a difference of 0.11%), and Immigrants from Guatemala (11.6%, a difference of 0.11%).
| Demographics | Rating | Rank | Disability |
| Immigrants | Sudan | 85.3 /100 | #142 | Excellent 11.5% |
| Moroccans | 83.3 /100 | #143 | Excellent 11.5% |
| Australians | 82.5 /100 | #144 | Excellent 11.5% |
| Nigerians | 81.3 /100 | #145 | Excellent 11.5% |
| Immigrants | Hungary | 79.0 /100 | #146 | Good 11.5% |
| Immigrants | Ukraine | 77.6 /100 | #147 | Good 11.5% |
| Sudanese | 77.1 /100 | #148 | Good 11.5% |
| Immigrants | Norway | 73.2 /100 | #149 | Good 11.6% |
| Romanians | 72.7 /100 | #150 | Good 11.6% |
| Immigrants | Kenya | 72.1 /100 | #151 | Good 11.6% |
| Immigrants | Moldova | 72.0 /100 | #152 | Good 11.6% |
| Immigrants | Ghana | 71.2 /100 | #153 | Good 11.6% |
| Immigrants | Guatemala | 71.1 /100 | #154 | Good 11.6% |
| Immigrants | Netherlands | 69.8 /100 | #155 | Good 11.6% |
| Immigrants | Fiji | 69.5 /100 | #156 | Good 11.6% |
Demographics Similar to Soviet Union by Disability
In terms of disability, the demographic groups most similar to Soviet Union are Vietnamese (10.9%, a difference of 0.060%), Immigrants from Saudi Arabia (10.9%, a difference of 0.060%), Peruvian (10.9%, a difference of 0.070%), South American (10.9%, a difference of 0.13%), and Immigrants from Spain (10.9%, a difference of 0.15%).
| Demographics | Rating | Rank | Disability |
| Immigrants | Australia | 99.9 /100 | #41 | Exceptional 10.8% |
| Immigrants | Nepal | 99.9 /100 | #42 | Exceptional 10.8% |
| Israelis | 99.9 /100 | #43 | Exceptional 10.8% |
| Immigrants | Japan | 99.9 /100 | #44 | Exceptional 10.8% |
| Immigrants | Peru | 99.9 /100 | #45 | Exceptional 10.8% |
| Tongans | 99.9 /100 | #46 | Exceptional 10.8% |
| Taiwanese | 99.9 /100 | #47 | Exceptional 10.8% |
| Soviet Union | 99.9 /100 | #48 | Exceptional 10.9% |
| Vietnamese | 99.9 /100 | #49 | Exceptional 10.9% |
| Immigrants | Saudi Arabia | 99.9 /100 | #50 | Exceptional 10.9% |
| Peruvians | 99.8 /100 | #51 | Exceptional 10.9% |
| South Americans | 99.8 /100 | #52 | Exceptional 10.9% |
| Immigrants | Spain | 99.8 /100 | #53 | Exceptional 10.9% |
| Jordanians | 99.8 /100 | #54 | Exceptional 10.9% |
| Immigrants | El Salvador | 99.8 /100 | #55 | Exceptional 10.9% |