Immigrants from North Macedonia vs Okinawan Ambulatory Disability
COMPARE
Immigrants from North Macedonia
Okinawan
Ambulatory Disability
Ambulatory Disability Comparison
Immigrants from North Macedonia
Okinawans
6.0%
AMBULATORY DISABILITY
84.1/ 100
METRIC RATING
136th/ 347
METRIC RANK
5.3%
AMBULATORY DISABILITY
100.0/ 100
METRIC RATING
12th/ 347
METRIC RANK
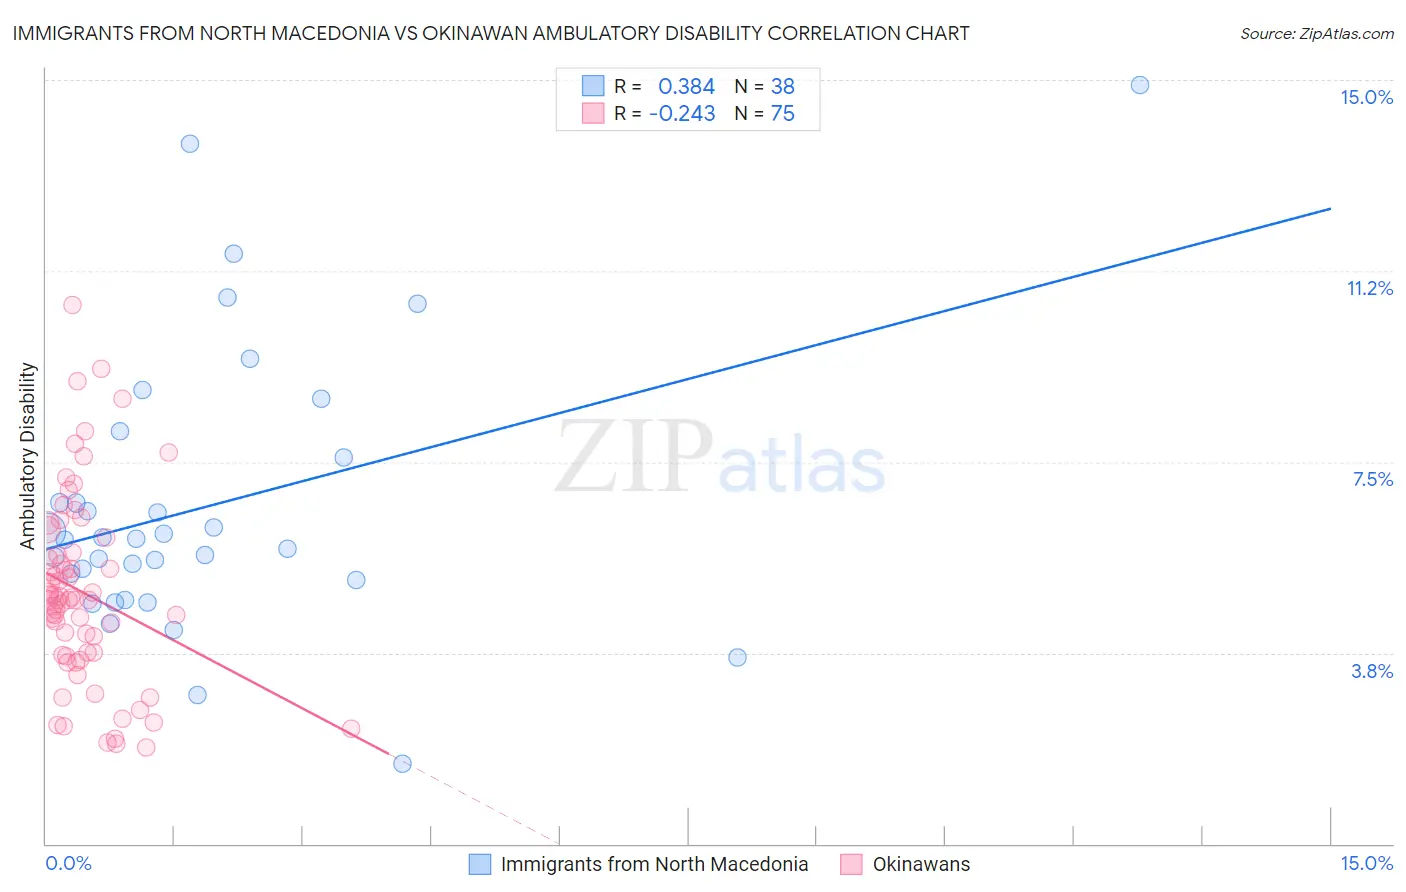
Immigrants from North Macedonia vs Okinawan Ambulatory Disability Correlation Chart
The statistical analysis conducted on geographies consisting of 74,316,752 people shows a mild positive correlation between the proportion of Immigrants from North Macedonia and percentage of population with ambulatory disability in the United States with a correlation coefficient (R) of 0.384 and weighted average of 6.0%. Similarly, the statistical analysis conducted on geographies consisting of 73,734,691 people shows a weak negative correlation between the proportion of Okinawans and percentage of population with ambulatory disability in the United States with a correlation coefficient (R) of -0.243 and weighted average of 5.3%, a difference of 13.8%.
Ambulatory Disability Correlation Summary
| Measurement | Immigrants from North Macedonia | Okinawan |
| Minimum | 1.6% | 1.9% |
| Maximum | 14.9% | 10.6% |
| Range | 13.3% | 8.7% |
| Mean | 6.6% | 4.9% |
| Median | 6.0% | 4.8% |
| Interquartile 25% (IQ1) | 5.2% | 3.7% |
| Interquartile 75% (IQ3) | 7.6% | 5.7% |
| Interquartile Range (IQR) | 2.4% | 2.0% |
| Standard Deviation (Sample) | 2.8% | 1.8% |
| Standard Deviation (Population) | 2.7% | 1.8% |
Similar Demographics by Ambulatory Disability
Demographics Similar to Immigrants from North Macedonia by Ambulatory Disability
In terms of ambulatory disability, the demographic groups most similar to Immigrants from North Macedonia are Immigrants from Syria (6.0%, a difference of 0.0%), Immigrants from Hungary (6.0%, a difference of 0.020%), Immigrants from Zaire (6.0%, a difference of 0.050%), Czech (6.0%, a difference of 0.080%), and Immigrants from Italy (6.0%, a difference of 0.090%).
| Demographics | Rating | Rank | Ambulatory Disability |
| Immigrants | Norway | 90.5 /100 | #129 | Exceptional 5.9% |
| Immigrants | Kazakhstan | 89.7 /100 | #130 | Excellent 5.9% |
| Immigrants | Costa Rica | 89.5 /100 | #131 | Excellent 5.9% |
| Immigrants | Europe | 87.8 /100 | #132 | Excellent 6.0% |
| Immigrants | Immigrants | 86.9 /100 | #133 | Excellent 6.0% |
| Ute | 86.6 /100 | #134 | Excellent 6.0% |
| Immigrants | Italy | 85.0 /100 | #135 | Excellent 6.0% |
| Immigrants | North Macedonia | 84.1 /100 | #136 | Excellent 6.0% |
| Immigrants | Syria | 84.1 /100 | #137 | Excellent 6.0% |
| Immigrants | Hungary | 83.9 /100 | #138 | Excellent 6.0% |
| Immigrants | Zaire | 83.6 /100 | #139 | Excellent 6.0% |
| Czechs | 83.3 /100 | #140 | Excellent 6.0% |
| Swedes | 83.1 /100 | #141 | Excellent 6.0% |
| Immigrants | Philippines | 83.0 /100 | #142 | Excellent 6.0% |
| Romanians | 82.9 /100 | #143 | Excellent 6.0% |
Demographics Similar to Okinawans by Ambulatory Disability
In terms of ambulatory disability, the demographic groups most similar to Okinawans are Immigrants from Korea (5.2%, a difference of 0.31%), Burmese (5.3%, a difference of 0.50%), Immigrants from Eastern Asia (5.3%, a difference of 0.65%), Immigrants from China (5.3%, a difference of 0.98%), and Immigrants from Hong Kong (5.3%, a difference of 1.5%).
| Demographics | Rating | Rank | Ambulatory Disability |
| Immigrants | Singapore | 100.0 /100 | #5 | Exceptional 5.0% |
| Immigrants | Bolivia | 100.0 /100 | #6 | Exceptional 5.0% |
| Bolivians | 100.0 /100 | #7 | Exceptional 5.1% |
| Immigrants | South Central Asia | 100.0 /100 | #8 | Exceptional 5.1% |
| Iranians | 100.0 /100 | #9 | Exceptional 5.1% |
| Yup'ik | 100.0 /100 | #10 | Exceptional 5.2% |
| Immigrants | Korea | 100.0 /100 | #11 | Exceptional 5.2% |
| Okinawans | 100.0 /100 | #12 | Exceptional 5.3% |
| Burmese | 100.0 /100 | #13 | Exceptional 5.3% |
| Immigrants | Eastern Asia | 100.0 /100 | #14 | Exceptional 5.3% |
| Immigrants | China | 100.0 /100 | #15 | Exceptional 5.3% |
| Immigrants | Hong Kong | 100.0 /100 | #16 | Exceptional 5.3% |
| Immigrants | Ethiopia | 100.0 /100 | #17 | Exceptional 5.4% |
| Immigrants | Sri Lanka | 100.0 /100 | #18 | Exceptional 5.4% |
| Indians (Asian) | 100.0 /100 | #19 | Exceptional 5.4% |