Immigrants from North Macedonia vs Immigrants from the Azores Ambulatory Disability
COMPARE
Immigrants from North Macedonia
Immigrants from the Azores
Ambulatory Disability
Ambulatory Disability Comparison
Immigrants from North Macedonia
Immigrants from the Azores
6.0%
AMBULATORY DISABILITY
84.1/ 100
METRIC RATING
136th/ 347
METRIC RANK
7.1%
AMBULATORY DISABILITY
0.0/ 100
METRIC RATING
309th/ 347
METRIC RANK
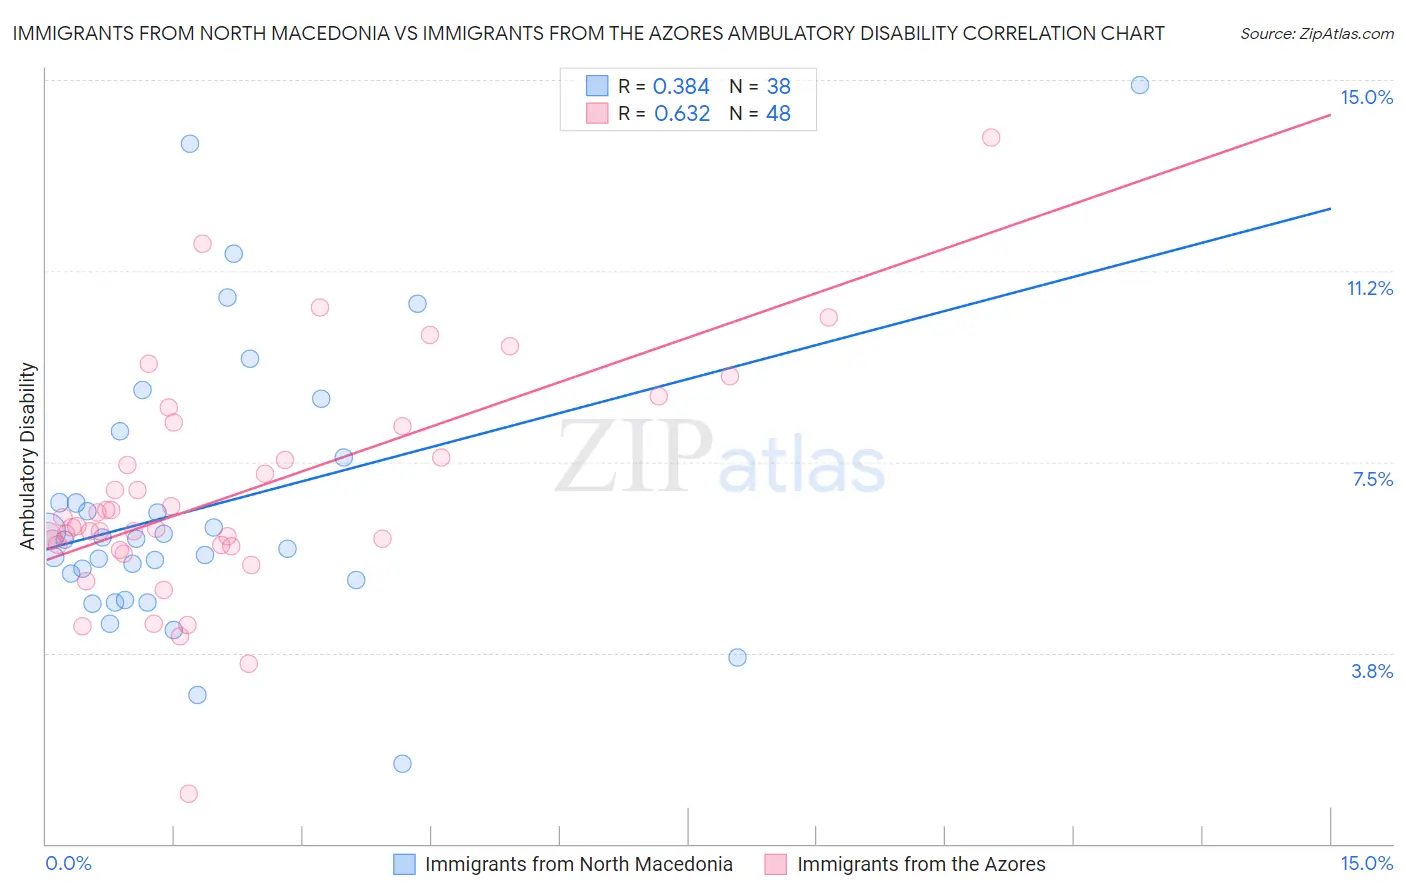
Immigrants from North Macedonia vs Immigrants from the Azores Ambulatory Disability Correlation Chart
The statistical analysis conducted on geographies consisting of 74,316,752 people shows a mild positive correlation between the proportion of Immigrants from North Macedonia and percentage of population with ambulatory disability in the United States with a correlation coefficient (R) of 0.384 and weighted average of 6.0%. Similarly, the statistical analysis conducted on geographies consisting of 46,257,178 people shows a significant positive correlation between the proportion of Immigrants from the Azores and percentage of population with ambulatory disability in the United States with a correlation coefficient (R) of 0.632 and weighted average of 7.1%, a difference of 18.4%.
Ambulatory Disability Correlation Summary
| Measurement | Immigrants from North Macedonia | Immigrants from the Azores |
| Minimum | 1.6% | 0.99% |
| Maximum | 14.9% | 13.9% |
| Range | 13.3% | 12.9% |
| Mean | 6.6% | 6.8% |
| Median | 6.0% | 6.2% |
| Interquartile 25% (IQ1) | 5.2% | 5.9% |
| Interquartile 75% (IQ3) | 7.6% | 7.9% |
| Interquartile Range (IQR) | 2.4% | 2.0% |
| Standard Deviation (Sample) | 2.8% | 2.2% |
| Standard Deviation (Population) | 2.7% | 2.2% |
Similar Demographics by Ambulatory Disability
Demographics Similar to Immigrants from North Macedonia by Ambulatory Disability
In terms of ambulatory disability, the demographic groups most similar to Immigrants from North Macedonia are Immigrants from Syria (6.0%, a difference of 0.0%), Immigrants from Hungary (6.0%, a difference of 0.020%), Immigrants from Zaire (6.0%, a difference of 0.050%), Czech (6.0%, a difference of 0.080%), and Immigrants from Italy (6.0%, a difference of 0.090%).
| Demographics | Rating | Rank | Ambulatory Disability |
| Immigrants | Norway | 90.5 /100 | #129 | Exceptional 5.9% |
| Immigrants | Kazakhstan | 89.7 /100 | #130 | Excellent 5.9% |
| Immigrants | Costa Rica | 89.5 /100 | #131 | Excellent 5.9% |
| Immigrants | Europe | 87.8 /100 | #132 | Excellent 6.0% |
| Immigrants | Immigrants | 86.9 /100 | #133 | Excellent 6.0% |
| Ute | 86.6 /100 | #134 | Excellent 6.0% |
| Immigrants | Italy | 85.0 /100 | #135 | Excellent 6.0% |
| Immigrants | North Macedonia | 84.1 /100 | #136 | Excellent 6.0% |
| Immigrants | Syria | 84.1 /100 | #137 | Excellent 6.0% |
| Immigrants | Hungary | 83.9 /100 | #138 | Excellent 6.0% |
| Immigrants | Zaire | 83.6 /100 | #139 | Excellent 6.0% |
| Czechs | 83.3 /100 | #140 | Excellent 6.0% |
| Swedes | 83.1 /100 | #141 | Excellent 6.0% |
| Immigrants | Philippines | 83.0 /100 | #142 | Excellent 6.0% |
| Romanians | 82.9 /100 | #143 | Excellent 6.0% |
Demographics Similar to Immigrants from the Azores by Ambulatory Disability
In terms of ambulatory disability, the demographic groups most similar to Immigrants from the Azores are Spanish American (7.1%, a difference of 0.17%), Chippewa (7.1%, a difference of 0.17%), Arapaho (7.1%, a difference of 0.28%), Cree (7.1%, a difference of 0.29%), and Iroquois (7.1%, a difference of 0.44%).
| Demographics | Rating | Rank | Ambulatory Disability |
| Immigrants | Armenia | 0.0 /100 | #302 | Tragic 7.0% |
| Africans | 0.0 /100 | #303 | Tragic 7.0% |
| Immigrants | Cabo Verde | 0.0 /100 | #304 | Tragic 7.0% |
| Immigrants | Micronesia | 0.0 /100 | #305 | Tragic 7.0% |
| Iroquois | 0.0 /100 | #306 | Tragic 7.1% |
| Spanish Americans | 0.0 /100 | #307 | Tragic 7.1% |
| Chippewa | 0.0 /100 | #308 | Tragic 7.1% |
| Immigrants | Azores | 0.0 /100 | #309 | Tragic 7.1% |
| Arapaho | 0.0 /100 | #310 | Tragic 7.1% |
| Cree | 0.0 /100 | #311 | Tragic 7.1% |
| Delaware | 0.0 /100 | #312 | Tragic 7.1% |
| Immigrants | Yemen | 0.0 /100 | #313 | Tragic 7.1% |
| Blackfeet | 0.0 /100 | #314 | Tragic 7.1% |
| Shoshone | 0.0 /100 | #315 | Tragic 7.1% |
| Immigrants | Dominican Republic | 0.0 /100 | #316 | Tragic 7.1% |