Immigrants from North Macedonia vs Nigerian Ambulatory Disability
COMPARE
Immigrants from North Macedonia
Nigerian
Ambulatory Disability
Ambulatory Disability Comparison
Immigrants from North Macedonia
Nigerians
6.0%
AMBULATORY DISABILITY
84.1/ 100
METRIC RATING
136th/ 347
METRIC RANK
6.1%
AMBULATORY DISABILITY
67.1/ 100
METRIC RATING
162nd/ 347
METRIC RANK
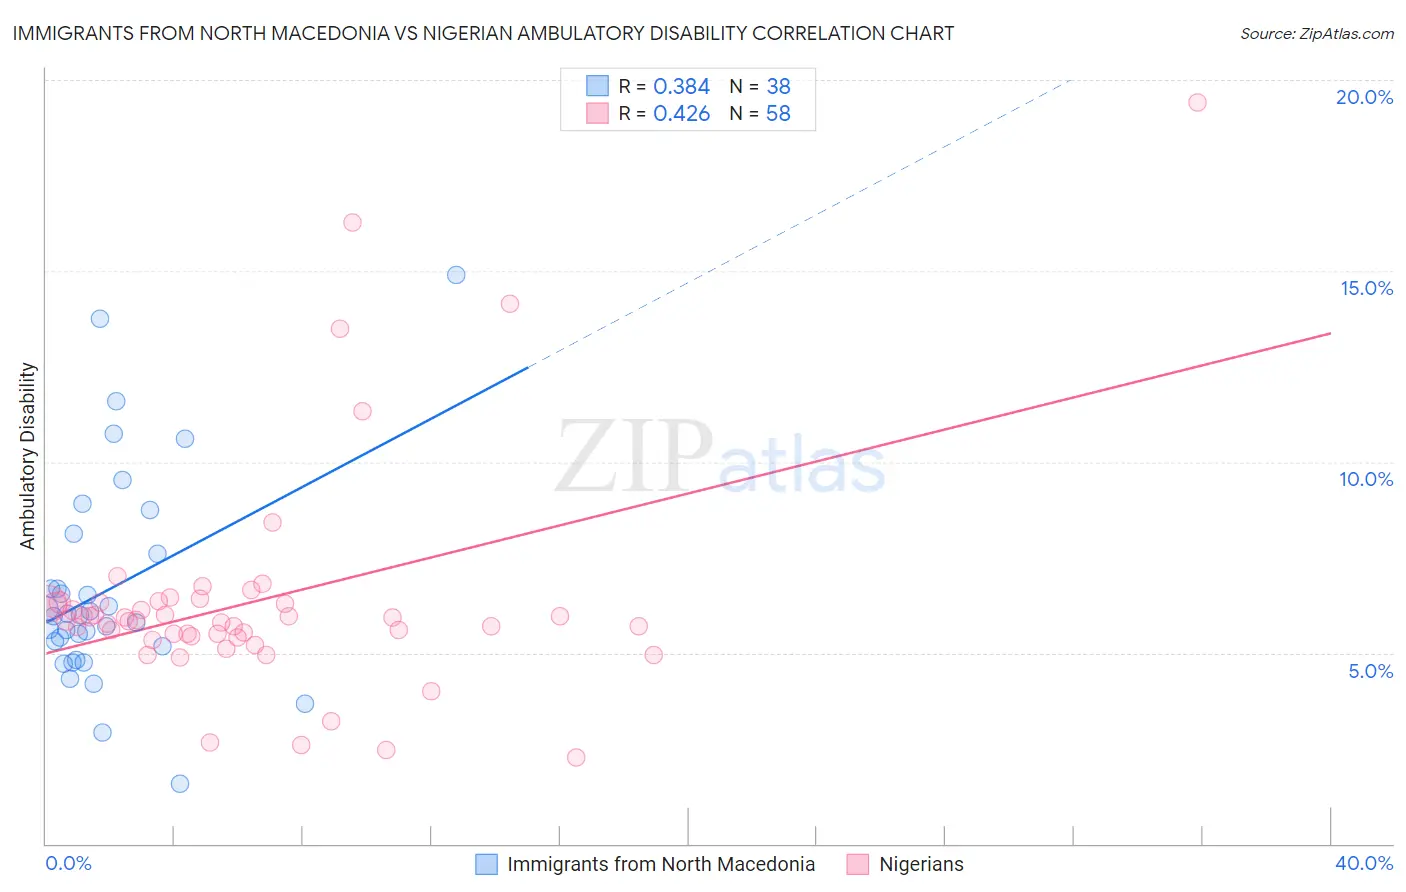
Immigrants from North Macedonia vs Nigerian Ambulatory Disability Correlation Chart
The statistical analysis conducted on geographies consisting of 74,316,752 people shows a mild positive correlation between the proportion of Immigrants from North Macedonia and percentage of population with ambulatory disability in the United States with a correlation coefficient (R) of 0.384 and weighted average of 6.0%. Similarly, the statistical analysis conducted on geographies consisting of 332,639,431 people shows a moderate positive correlation between the proportion of Nigerians and percentage of population with ambulatory disability in the United States with a correlation coefficient (R) of 0.426 and weighted average of 6.1%, a difference of 1.3%.
Ambulatory Disability Correlation Summary
| Measurement | Immigrants from North Macedonia | Nigerian |
| Minimum | 1.6% | 2.2% |
| Maximum | 14.9% | 19.4% |
| Range | 13.3% | 17.2% |
| Mean | 6.6% | 6.4% |
| Median | 6.0% | 5.9% |
| Interquartile 25% (IQ1) | 5.2% | 5.4% |
| Interquartile 75% (IQ3) | 7.6% | 6.3% |
| Interquartile Range (IQR) | 2.4% | 0.90% |
| Standard Deviation (Sample) | 2.8% | 3.0% |
| Standard Deviation (Population) | 2.7% | 3.0% |
Similar Demographics by Ambulatory Disability
Demographics Similar to Immigrants from North Macedonia by Ambulatory Disability
In terms of ambulatory disability, the demographic groups most similar to Immigrants from North Macedonia are Immigrants from Syria (6.0%, a difference of 0.0%), Immigrants from Hungary (6.0%, a difference of 0.020%), Immigrants from Zaire (6.0%, a difference of 0.050%), Czech (6.0%, a difference of 0.080%), and Immigrants from Italy (6.0%, a difference of 0.090%).
| Demographics | Rating | Rank | Ambulatory Disability |
| Immigrants | Norway | 90.5 /100 | #129 | Exceptional 5.9% |
| Immigrants | Kazakhstan | 89.7 /100 | #130 | Excellent 5.9% |
| Immigrants | Costa Rica | 89.5 /100 | #131 | Excellent 5.9% |
| Immigrants | Europe | 87.8 /100 | #132 | Excellent 6.0% |
| Immigrants | Immigrants | 86.9 /100 | #133 | Excellent 6.0% |
| Ute | 86.6 /100 | #134 | Excellent 6.0% |
| Immigrants | Italy | 85.0 /100 | #135 | Excellent 6.0% |
| Immigrants | North Macedonia | 84.1 /100 | #136 | Excellent 6.0% |
| Immigrants | Syria | 84.1 /100 | #137 | Excellent 6.0% |
| Immigrants | Hungary | 83.9 /100 | #138 | Excellent 6.0% |
| Immigrants | Zaire | 83.6 /100 | #139 | Excellent 6.0% |
| Czechs | 83.3 /100 | #140 | Excellent 6.0% |
| Swedes | 83.1 /100 | #141 | Excellent 6.0% |
| Immigrants | Philippines | 83.0 /100 | #142 | Excellent 6.0% |
| Romanians | 82.9 /100 | #143 | Excellent 6.0% |
Demographics Similar to Nigerians by Ambulatory Disability
In terms of ambulatory disability, the demographic groups most similar to Nigerians are Lebanese (6.1%, a difference of 0.050%), Immigrants from Belarus (6.1%, a difference of 0.13%), Central American (6.0%, a difference of 0.17%), Basque (6.1%, a difference of 0.20%), and Nicaraguan (6.1%, a difference of 0.23%).
| Demographics | Rating | Rank | Ambulatory Disability |
| Immigrants | Scotland | 72.1 /100 | #155 | Good 6.0% |
| Northern Europeans | 71.8 /100 | #156 | Good 6.0% |
| Ghanaians | 71.3 /100 | #157 | Good 6.0% |
| Immigrants | Fiji | 71.2 /100 | #158 | Good 6.0% |
| Immigrants | Latvia | 71.1 /100 | #159 | Good 6.0% |
| Central Americans | 69.8 /100 | #160 | Good 6.0% |
| Immigrants | Belarus | 69.2 /100 | #161 | Good 6.1% |
| Nigerians | 67.1 /100 | #162 | Good 6.1% |
| Lebanese | 66.2 /100 | #163 | Good 6.1% |
| Basques | 63.7 /100 | #164 | Good 6.1% |
| Nicaraguans | 63.2 /100 | #165 | Good 6.1% |
| Iraqis | 62.8 /100 | #166 | Good 6.1% |
| Immigrants | Oceania | 60.7 /100 | #167 | Good 6.1% |
| Ecuadorians | 60.5 /100 | #168 | Good 6.1% |
| Immigrants | Southern Europe | 58.1 /100 | #169 | Average 6.1% |