Immigrants from Nigeria vs Immigrants from Dominican Republic Disability Age 5 to 17
COMPARE
Immigrants from Nigeria
Immigrants from Dominican Republic
Disability Age 5 to 17
Disability Age 5 to 17 Comparison
Immigrants from Nigeria
Immigrants from Dominican Republic
5.7%
DISABILITY AGE 5 TO 17
23.4/ 100
METRIC RATING
195th/ 347
METRIC RANK
6.4%
DISABILITY AGE 5 TO 17
0.0/ 100
METRIC RATING
316th/ 347
METRIC RANK
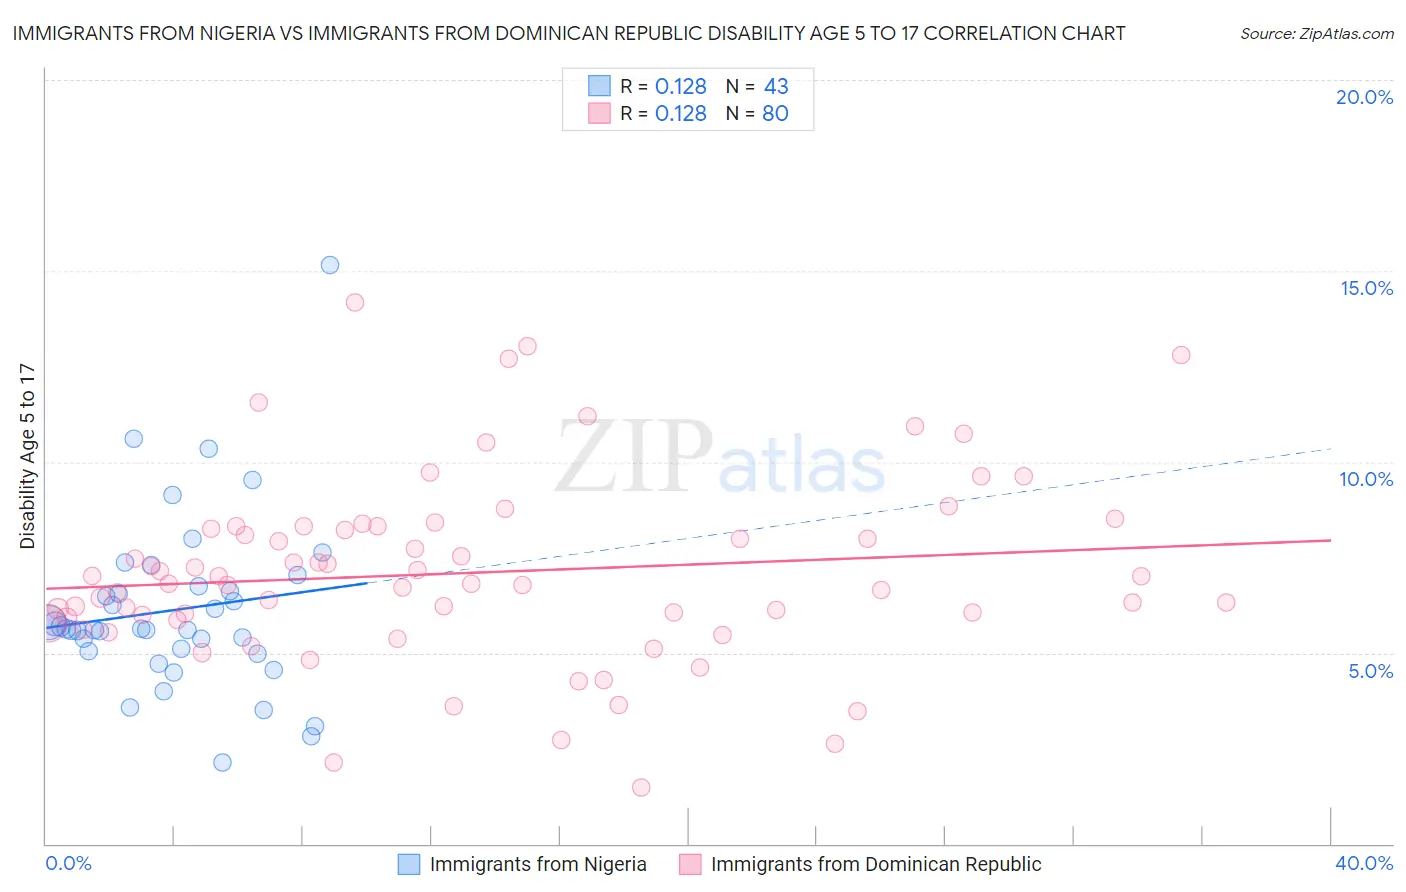
Immigrants from Nigeria vs Immigrants from Dominican Republic Disability Age 5 to 17 Correlation Chart
The statistical analysis conducted on geographies consisting of 282,146,479 people shows a poor positive correlation between the proportion of Immigrants from Nigeria and percentage of population with a disability between the ages 5 and 17 in the United States with a correlation coefficient (R) of 0.128 and weighted average of 5.7%. Similarly, the statistical analysis conducted on geographies consisting of 273,384,588 people shows a poor positive correlation between the proportion of Immigrants from Dominican Republic and percentage of population with a disability between the ages 5 and 17 in the United States with a correlation coefficient (R) of 0.128 and weighted average of 6.4%, a difference of 13.3%.
Disability Age 5 to 17 Correlation Summary
| Measurement | Immigrants from Nigeria | Immigrants from Dominican Republic |
| Minimum | 2.1% | 1.5% |
| Maximum | 15.2% | 14.2% |
| Range | 13.1% | 12.7% |
| Mean | 6.1% | 7.1% |
| Median | 5.6% | 6.8% |
| Interquartile 25% (IQ1) | 5.0% | 5.9% |
| Interquartile 75% (IQ3) | 6.8% | 8.3% |
| Interquartile Range (IQR) | 1.7% | 2.4% |
| Standard Deviation (Sample) | 2.3% | 2.4% |
| Standard Deviation (Population) | 2.3% | 2.4% |
Similar Demographics by Disability Age 5 to 17
Demographics Similar to Immigrants from Nigeria by Disability Age 5 to 17
In terms of disability age 5 to 17, the demographic groups most similar to Immigrants from Nigeria are Croatian (5.7%, a difference of 0.010%), Inupiat (5.7%, a difference of 0.010%), Immigrants from North America (5.7%, a difference of 0.020%), Immigrants from Canada (5.7%, a difference of 0.17%), and Norwegian (5.7%, a difference of 0.18%).
| Demographics | Rating | Rank | Disability Age 5 to 17 |
| Marshallese | 28.1 /100 | #188 | Fair 5.7% |
| Pueblo | 27.5 /100 | #189 | Fair 5.7% |
| Immigrants | Eastern Africa | 27.3 /100 | #190 | Fair 5.7% |
| Danes | 26.5 /100 | #191 | Fair 5.7% |
| Immigrants | Bosnia and Herzegovina | 26.3 /100 | #192 | Fair 5.7% |
| Immigrants | Canada | 26.1 /100 | #193 | Fair 5.7% |
| Croatians | 23.6 /100 | #194 | Fair 5.7% |
| Immigrants | Nigeria | 23.4 /100 | #195 | Fair 5.7% |
| Inupiat | 23.3 /100 | #196 | Fair 5.7% |
| Immigrants | North America | 23.1 /100 | #197 | Fair 5.7% |
| Norwegians | 20.9 /100 | #198 | Fair 5.7% |
| Northern Europeans | 15.2 /100 | #199 | Poor 5.7% |
| Icelanders | 14.6 /100 | #200 | Poor 5.7% |
| Basques | 13.7 /100 | #201 | Poor 5.7% |
| Austrians | 13.2 /100 | #202 | Poor 5.7% |
Demographics Similar to Immigrants from Dominican Republic by Disability Age 5 to 17
In terms of disability age 5 to 17, the demographic groups most similar to Immigrants from Dominican Republic are Kiowa (6.4%, a difference of 0.13%), Comanche (6.4%, a difference of 0.16%), Immigrants from Portugal (6.4%, a difference of 0.18%), French (6.4%, a difference of 0.36%), and Delaware (6.5%, a difference of 0.71%).
| Demographics | Rating | Rank | Disability Age 5 to 17 |
| Hmong | 0.0 /100 | #309 | Tragic 6.3% |
| Alaskan Athabascans | 0.0 /100 | #310 | Tragic 6.3% |
| Immigrants | Dominica | 0.0 /100 | #311 | Tragic 6.3% |
| Bermudans | 0.0 /100 | #312 | Tragic 6.4% |
| Apache | 0.0 /100 | #313 | Tragic 6.4% |
| French | 0.0 /100 | #314 | Tragic 6.4% |
| Immigrants | Portugal | 0.0 /100 | #315 | Tragic 6.4% |
| Immigrants | Dominican Republic | 0.0 /100 | #316 | Tragic 6.4% |
| Kiowa | 0.0 /100 | #317 | Tragic 6.4% |
| Comanche | 0.0 /100 | #318 | Tragic 6.4% |
| Delaware | 0.0 /100 | #319 | Tragic 6.5% |
| Africans | 0.0 /100 | #320 | Tragic 6.5% |
| Tohono O'odham | 0.0 /100 | #321 | Tragic 6.5% |
| Slovaks | 0.0 /100 | #322 | Tragic 6.5% |
| Osage | 0.0 /100 | #323 | Tragic 6.5% |