Immigrants from Nigeria vs Immigrants from Dominican Republic Householder Income Ages 45 - 64 years
COMPARE
Immigrants from Nigeria
Immigrants from Dominican Republic
Householder Income Ages 45 - 64 years
Householder Income Ages 45 - 64 years Comparison
Immigrants from Nigeria
Immigrants from Dominican Republic
$94,804
HOUSEHOLDER INCOME AGES 45 - 64 YEARS
5.9/ 100
METRIC RATING
221st/ 347
METRIC RANK
$78,836
HOUSEHOLDER INCOME AGES 45 - 64 YEARS
0.0/ 100
METRIC RATING
331st/ 347
METRIC RANK
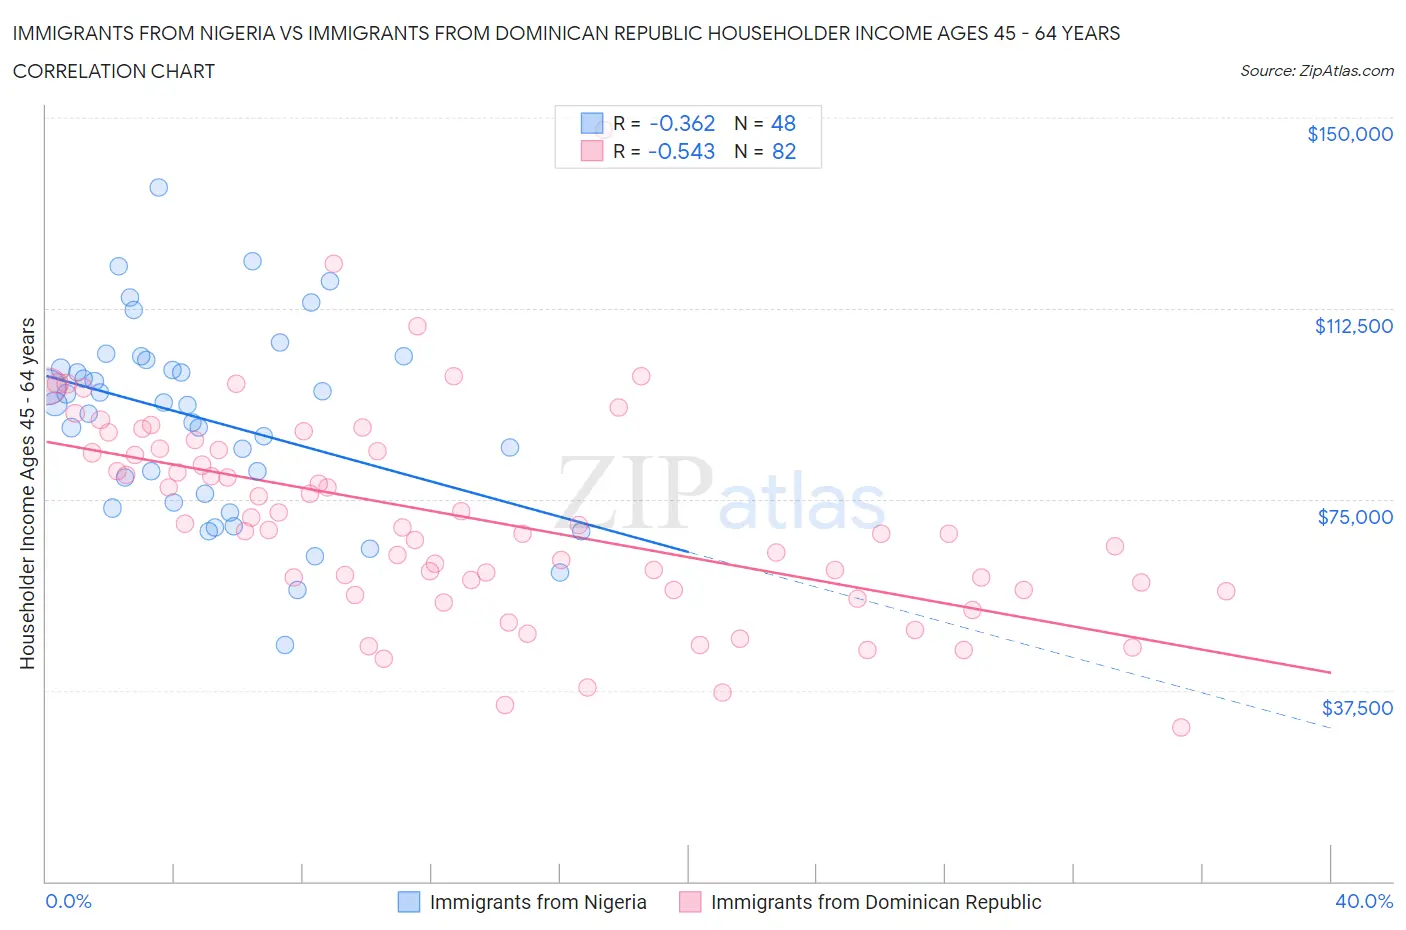
Immigrants from Nigeria vs Immigrants from Dominican Republic Householder Income Ages 45 - 64 years Correlation Chart
The statistical analysis conducted on geographies consisting of 283,069,423 people shows a mild negative correlation between the proportion of Immigrants from Nigeria and household income with householder between the ages 45 and 64 in the United States with a correlation coefficient (R) of -0.362 and weighted average of $94,804. Similarly, the statistical analysis conducted on geographies consisting of 274,687,311 people shows a substantial negative correlation between the proportion of Immigrants from Dominican Republic and household income with householder between the ages 45 and 64 in the United States with a correlation coefficient (R) of -0.543 and weighted average of $78,836, a difference of 20.3%.
Householder Income Ages 45 - 64 years Correlation Summary
| Measurement | Immigrants from Nigeria | Immigrants from Dominican Republic |
| Minimum | $46,429 | $30,156 |
| Maximum | $136,191 | $147,500 |
| Range | $89,762 | $117,344 |
| Mean | $90,499 | $71,398 |
| Median | $93,669 | $69,228 |
| Interquartile 25% (IQ1) | $75,303 | $57,193 |
| Interquartile 75% (IQ3) | $101,492 | $84,653 |
| Interquartile Range (IQR) | $26,189 | $27,460 |
| Standard Deviation (Sample) | $18,699 | $20,395 |
| Standard Deviation (Population) | $18,504 | $20,271 |
Similar Demographics by Householder Income Ages 45 - 64 years
Demographics Similar to Immigrants from Nigeria by Householder Income Ages 45 - 64 years
In terms of householder income ages 45 - 64 years, the demographic groups most similar to Immigrants from Nigeria are Salvadoran ($94,842, a difference of 0.040%), Immigrants from Armenia ($94,863, a difference of 0.060%), Delaware ($94,914, a difference of 0.12%), Immigrants from Ghana ($94,982, a difference of 0.19%), and Malaysian ($94,517, a difference of 0.30%).
| Demographics | Rating | Rank | Householder Income Ages 45 - 64 years |
| Panamanians | 10.6 /100 | #214 | Poor $96,066 |
| Nigerians | 8.2 /100 | #215 | Tragic $95,492 |
| Immigrants | Venezuela | 7.6 /100 | #216 | Tragic $95,342 |
| Immigrants | Ghana | 6.4 /100 | #217 | Tragic $94,982 |
| Delaware | 6.2 /100 | #218 | Tragic $94,914 |
| Immigrants | Armenia | 6.1 /100 | #219 | Tragic $94,863 |
| Salvadorans | 6.0 /100 | #220 | Tragic $94,842 |
| Immigrants | Nigeria | 5.9 /100 | #221 | Tragic $94,804 |
| Malaysians | 5.2 /100 | #222 | Tragic $94,517 |
| Immigrants | Nonimmigrants | 5.0 /100 | #223 | Tragic $94,448 |
| Immigrants | Bosnia and Herzegovina | 4.6 /100 | #224 | Tragic $94,288 |
| Bermudans | 4.4 /100 | #225 | Tragic $94,197 |
| Immigrants | Azores | 4.3 /100 | #226 | Tragic $94,138 |
| Alaska Natives | 4.0 /100 | #227 | Tragic $93,991 |
| Immigrants | Panama | 3.7 /100 | #228 | Tragic $93,815 |
Demographics Similar to Immigrants from Dominican Republic by Householder Income Ages 45 - 64 years
In terms of householder income ages 45 - 64 years, the demographic groups most similar to Immigrants from Dominican Republic are Creek ($78,960, a difference of 0.16%), Black/African American ($78,556, a difference of 0.36%), Dutch West Indian ($79,171, a difference of 0.42%), Native/Alaskan ($79,816, a difference of 1.2%), and Immigrants from Congo ($77,850, a difference of 1.3%).
| Demographics | Rating | Rank | Householder Income Ages 45 - 64 years |
| Yup'ik | 0.0 /100 | #324 | Tragic $81,000 |
| Immigrants | Cuba | 0.0 /100 | #325 | Tragic $80,662 |
| Dominicans | 0.0 /100 | #326 | Tragic $80,623 |
| Seminole | 0.0 /100 | #327 | Tragic $80,077 |
| Natives/Alaskans | 0.0 /100 | #328 | Tragic $79,816 |
| Dutch West Indians | 0.0 /100 | #329 | Tragic $79,171 |
| Creek | 0.0 /100 | #330 | Tragic $78,960 |
| Immigrants | Dominican Republic | 0.0 /100 | #331 | Tragic $78,836 |
| Blacks/African Americans | 0.0 /100 | #332 | Tragic $78,556 |
| Immigrants | Congo | 0.0 /100 | #333 | Tragic $77,850 |
| Menominee | 0.0 /100 | #334 | Tragic $76,903 |
| Cheyenne | 0.0 /100 | #335 | Tragic $76,362 |
| Arapaho | 0.0 /100 | #336 | Tragic $75,945 |
| Pueblo | 0.0 /100 | #337 | Tragic $75,601 |
| Hopi | 0.0 /100 | #338 | Tragic $75,562 |