Immigrants from Nigeria vs Immigrants from Dominican Republic Median Female Earnings
COMPARE
Immigrants from Nigeria
Immigrants from Dominican Republic
Median Female Earnings
Median Female Earnings Comparison
Immigrants from Nigeria
Immigrants from Dominican Republic
$39,294
MEDIAN FEMALE EARNINGS
30.2/ 100
METRIC RATING
193rd/ 347
METRIC RANK
$36,857
MEDIAN FEMALE EARNINGS
0.3/ 100
METRIC RATING
272nd/ 347
METRIC RANK
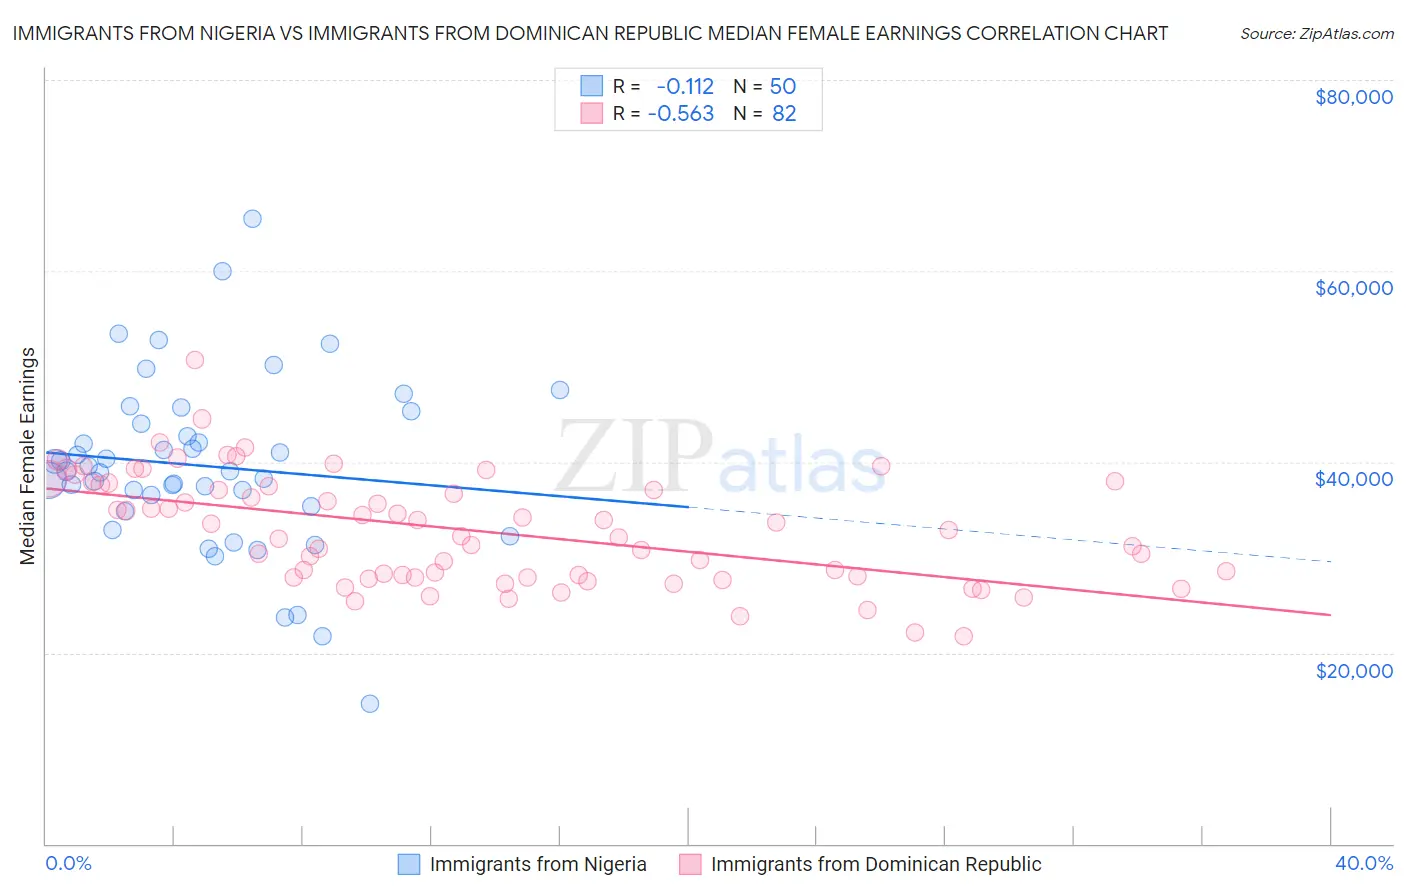
Immigrants from Nigeria vs Immigrants from Dominican Republic Median Female Earnings Correlation Chart
The statistical analysis conducted on geographies consisting of 283,458,757 people shows a poor negative correlation between the proportion of Immigrants from Nigeria and median female earnings in the United States with a correlation coefficient (R) of -0.112 and weighted average of $39,294. Similarly, the statistical analysis conducted on geographies consisting of 275,036,579 people shows a substantial negative correlation between the proportion of Immigrants from Dominican Republic and median female earnings in the United States with a correlation coefficient (R) of -0.563 and weighted average of $36,857, a difference of 6.6%.
Median Female Earnings Correlation Summary
| Measurement | Immigrants from Nigeria | Immigrants from Dominican Republic |
| Minimum | $14,696 | $21,771 |
| Maximum | $65,528 | $50,664 |
| Range | $50,832 | $28,893 |
| Mean | $39,545 | $32,854 |
| Median | $39,021 | $32,506 |
| Interquartile 25% (IQ1) | $35,340 | $27,940 |
| Interquartile 75% (IQ3) | $44,001 | $37,608 |
| Interquartile Range (IQR) | $8,661 | $9,668 |
| Standard Deviation (Sample) | $9,154 | $5,745 |
| Standard Deviation (Population) | $9,062 | $5,709 |
Similar Demographics by Median Female Earnings
Demographics Similar to Immigrants from Nigeria by Median Female Earnings
In terms of median female earnings, the demographic groups most similar to Immigrants from Nigeria are Irish ($39,291, a difference of 0.010%), Immigrants ($39,328, a difference of 0.090%), Immigrants from Western Africa ($39,351, a difference of 0.14%), Uruguayan ($39,228, a difference of 0.17%), and Puget Sound Salish ($39,376, a difference of 0.21%).
| Demographics | Rating | Rank | Median Female Earnings |
| Colombians | 36.9 /100 | #186 | Fair $39,439 |
| Swedes | 36.0 /100 | #187 | Fair $39,421 |
| Bermudans | 35.9 /100 | #188 | Fair $39,418 |
| Senegalese | 34.2 /100 | #189 | Fair $39,384 |
| Puget Sound Salish | 33.9 /100 | #190 | Fair $39,376 |
| Immigrants | Western Africa | 32.7 /100 | #191 | Fair $39,351 |
| Immigrants | Immigrants | 31.7 /100 | #192 | Fair $39,328 |
| Immigrants | Nigeria | 30.2 /100 | #193 | Fair $39,294 |
| Irish | 30.0 /100 | #194 | Fair $39,291 |
| Uruguayans | 27.3 /100 | #195 | Fair $39,228 |
| Immigrants | Costa Rica | 25.6 /100 | #196 | Fair $39,186 |
| Assyrians/Chaldeans/Syriacs | 24.6 /100 | #197 | Fair $39,159 |
| Ecuadorians | 23.0 /100 | #198 | Fair $39,117 |
| Icelanders | 22.7 /100 | #199 | Fair $39,109 |
| Immigrants | Panama | 20.6 /100 | #200 | Fair $39,049 |
Demographics Similar to Immigrants from Dominican Republic by Median Female Earnings
In terms of median female earnings, the demographic groups most similar to Immigrants from Dominican Republic are Immigrants from Laos ($36,841, a difference of 0.040%), Nicaraguan ($36,904, a difference of 0.13%), French American Indian ($36,920, a difference of 0.17%), Immigrants from Venezuela ($37,003, a difference of 0.39%), and Cree ($37,018, a difference of 0.44%).
| Demographics | Rating | Rank | Median Female Earnings |
| Immigrants | Belize | 0.4 /100 | #265 | Tragic $37,056 |
| Dominicans | 0.4 /100 | #266 | Tragic $37,046 |
| Immigrants | Nonimmigrants | 0.4 /100 | #267 | Tragic $37,024 |
| Cree | 0.4 /100 | #268 | Tragic $37,018 |
| Immigrants | Venezuela | 0.4 /100 | #269 | Tragic $37,003 |
| French American Indians | 0.3 /100 | #270 | Tragic $36,920 |
| Nicaraguans | 0.3 /100 | #271 | Tragic $36,904 |
| Immigrants | Dominican Republic | 0.3 /100 | #272 | Tragic $36,857 |
| Immigrants | Laos | 0.3 /100 | #273 | Tragic $36,841 |
| Immigrants | El Salvador | 0.2 /100 | #274 | Tragic $36,673 |
| Africans | 0.1 /100 | #275 | Tragic $36,530 |
| Central Americans | 0.1 /100 | #276 | Tragic $36,492 |
| Marshallese | 0.1 /100 | #277 | Tragic $36,459 |
| U.S. Virgin Islanders | 0.1 /100 | #278 | Tragic $36,424 |
| Immigrants | Caribbean | 0.1 /100 | #279 | Tragic $36,414 |