Immigrants from Nigeria vs Immigrants from Dominican Republic Unemployment Among Ages 65 to 74 years
COMPARE
Immigrants from Nigeria
Immigrants from Dominican Republic
Unemployment Among Ages 65 to 74 years
Unemployment Among Ages 65 to 74 years Comparison
Immigrants from Nigeria
Immigrants from Dominican Republic
5.7%
UNEMPLOYMENT AMONG AGES 65 TO 74 YEARS
0.1/ 100
METRIC RATING
270th/ 347
METRIC RANK
6.3%
UNEMPLOYMENT AMONG AGES 65 TO 74 YEARS
0.0/ 100
METRIC RATING
332nd/ 347
METRIC RANK
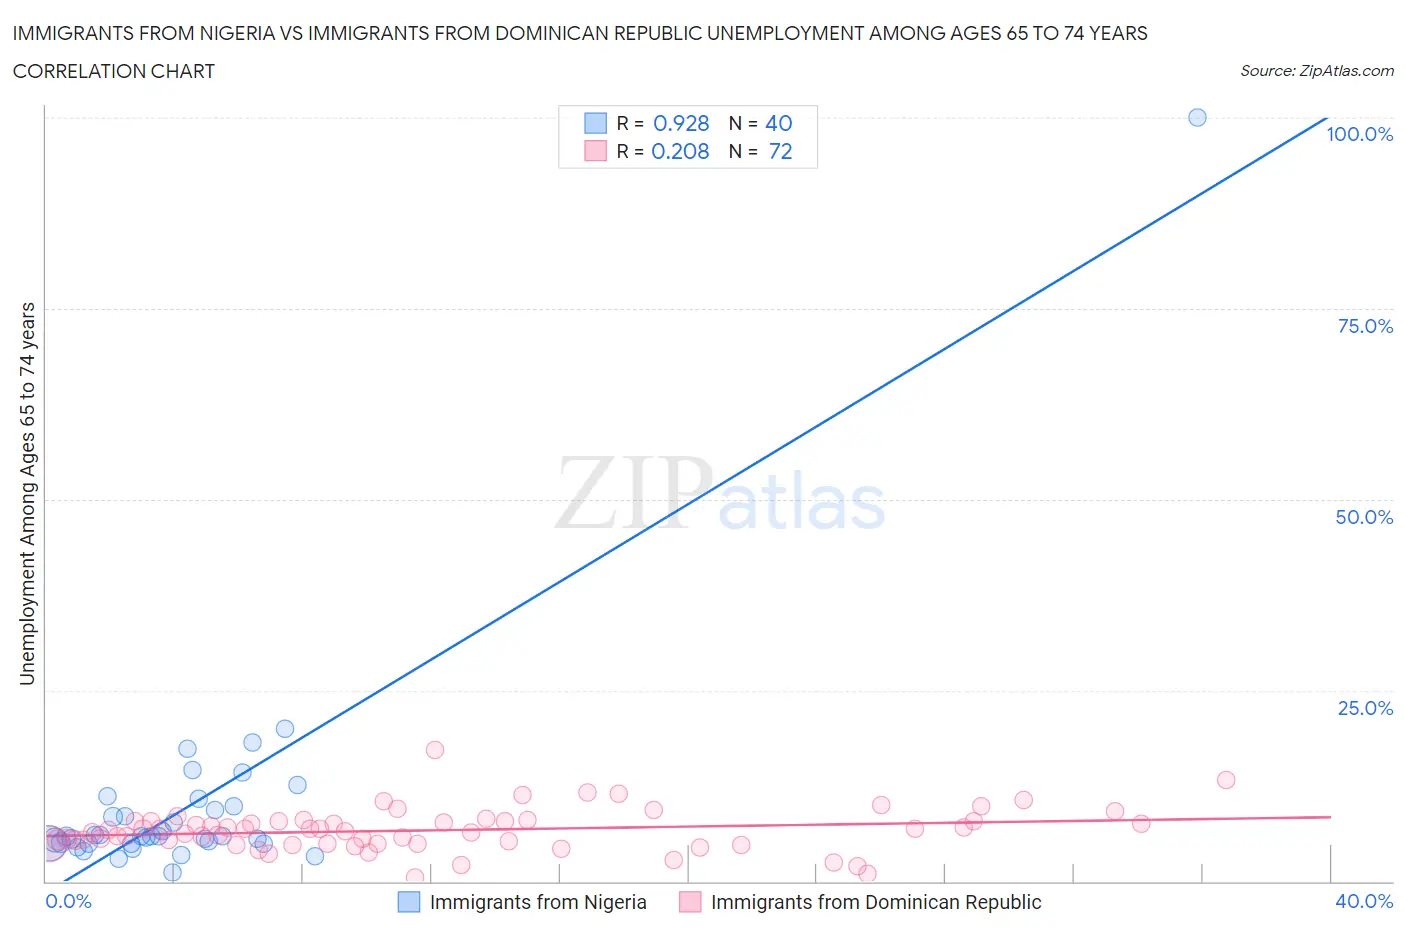
Immigrants from Nigeria vs Immigrants from Dominican Republic Unemployment Among Ages 65 to 74 years Correlation Chart
The statistical analysis conducted on geographies consisting of 261,086,383 people shows a near-perfect positive correlation between the proportion of Immigrants from Nigeria and unemployment rate among population between the ages 65 and 74 in the United States with a correlation coefficient (R) of 0.928 and weighted average of 5.7%. Similarly, the statistical analysis conducted on geographies consisting of 249,538,420 people shows a weak positive correlation between the proportion of Immigrants from Dominican Republic and unemployment rate among population between the ages 65 and 74 in the United States with a correlation coefficient (R) of 0.208 and weighted average of 6.3%, a difference of 11.2%.
Unemployment Among Ages 65 to 74 years Correlation Summary
| Measurement | Immigrants from Nigeria | Immigrants from Dominican Republic |
| Minimum | 1.2% | 0.50% |
| Maximum | 100.0% | 17.1% |
| Range | 98.8% | 16.6% |
| Mean | 9.8% | 6.7% |
| Median | 5.9% | 6.6% |
| Interquartile 25% (IQ1) | 5.0% | 4.9% |
| Interquartile 75% (IQ3) | 9.5% | 7.9% |
| Interquartile Range (IQR) | 4.6% | 3.0% |
| Standard Deviation (Sample) | 15.2% | 2.8% |
| Standard Deviation (Population) | 15.1% | 2.7% |
Similar Demographics by Unemployment Among Ages 65 to 74 years
Demographics Similar to Immigrants from Nigeria by Unemployment Among Ages 65 to 74 years
In terms of unemployment among ages 65 to 74 years, the demographic groups most similar to Immigrants from Nigeria are Immigrants from Colombia (5.7%, a difference of 0.030%), Belizean (5.7%, a difference of 0.030%), Yaqui (5.7%, a difference of 0.050%), Bahamian (5.7%, a difference of 0.070%), and Immigrants from Guyana (5.7%, a difference of 0.090%).
| Demographics | Rating | Rank | Unemployment Among Ages 65 to 74 years |
| Immigrants | Jamaica | 0.2 /100 | #263 | Tragic 5.6% |
| Pueblo | 0.2 /100 | #264 | Tragic 5.6% |
| Jamaicans | 0.2 /100 | #265 | Tragic 5.6% |
| French Canadians | 0.2 /100 | #266 | Tragic 5.6% |
| Guyanese | 0.2 /100 | #267 | Tragic 5.6% |
| Hawaiians | 0.2 /100 | #268 | Tragic 5.7% |
| Immigrants | Colombia | 0.1 /100 | #269 | Tragic 5.7% |
| Immigrants | Nigeria | 0.1 /100 | #270 | Tragic 5.7% |
| Belizeans | 0.1 /100 | #271 | Tragic 5.7% |
| Yaqui | 0.1 /100 | #272 | Tragic 5.7% |
| Bahamians | 0.1 /100 | #273 | Tragic 5.7% |
| Immigrants | Guyana | 0.1 /100 | #274 | Tragic 5.7% |
| Immigrants | Liberia | 0.1 /100 | #275 | Tragic 5.7% |
| Somalis | 0.1 /100 | #276 | Tragic 5.7% |
| Immigrants | South America | 0.1 /100 | #277 | Tragic 5.7% |
Demographics Similar to Immigrants from Dominican Republic by Unemployment Among Ages 65 to 74 years
In terms of unemployment among ages 65 to 74 years, the demographic groups most similar to Immigrants from Dominican Republic are Paiute (6.3%, a difference of 0.10%), Taiwanese (6.3%, a difference of 0.22%), Bermudan (6.3%, a difference of 0.32%), Dominican (6.3%, a difference of 0.46%), and Yuman (6.2%, a difference of 0.77%).
| Demographics | Rating | Rank | Unemployment Among Ages 65 to 74 years |
| Immigrants | Portugal | 0.0 /100 | #325 | Tragic 6.0% |
| Natives/Alaskans | 0.0 /100 | #326 | Tragic 6.0% |
| Shoshone | 0.0 /100 | #327 | Tragic 6.2% |
| Immigrants | Azores | 0.0 /100 | #328 | Tragic 6.2% |
| Yuman | 0.0 /100 | #329 | Tragic 6.2% |
| Dominicans | 0.0 /100 | #330 | Tragic 6.3% |
| Bermudans | 0.0 /100 | #331 | Tragic 6.3% |
| Immigrants | Dominican Republic | 0.0 /100 | #332 | Tragic 6.3% |
| Paiute | 0.0 /100 | #333 | Tragic 6.3% |
| Taiwanese | 0.0 /100 | #334 | Tragic 6.3% |
| Puerto Ricans | 0.0 /100 | #335 | Tragic 6.4% |
| Immigrants | Armenia | 0.0 /100 | #336 | Tragic 6.5% |
| Ute | 0.0 /100 | #337 | Tragic 6.5% |
| Tlingit-Haida | 0.0 /100 | #338 | Tragic 6.5% |
| Yakama | 0.0 /100 | #339 | Tragic 6.6% |