Immigrants from Micronesia vs Delaware Self-Care Disability
COMPARE
Immigrants from Micronesia
Delaware
Self-Care Disability
Self-Care Disability Comparison
Immigrants from Micronesia
Delaware
2.7%
SELF-CARE DISABILITY
0.1/ 100
METRIC RATING
270th/ 347
METRIC RANK
2.7%
SELF-CARE DISABILITY
0.0/ 100
METRIC RATING
283rd/ 347
METRIC RANK
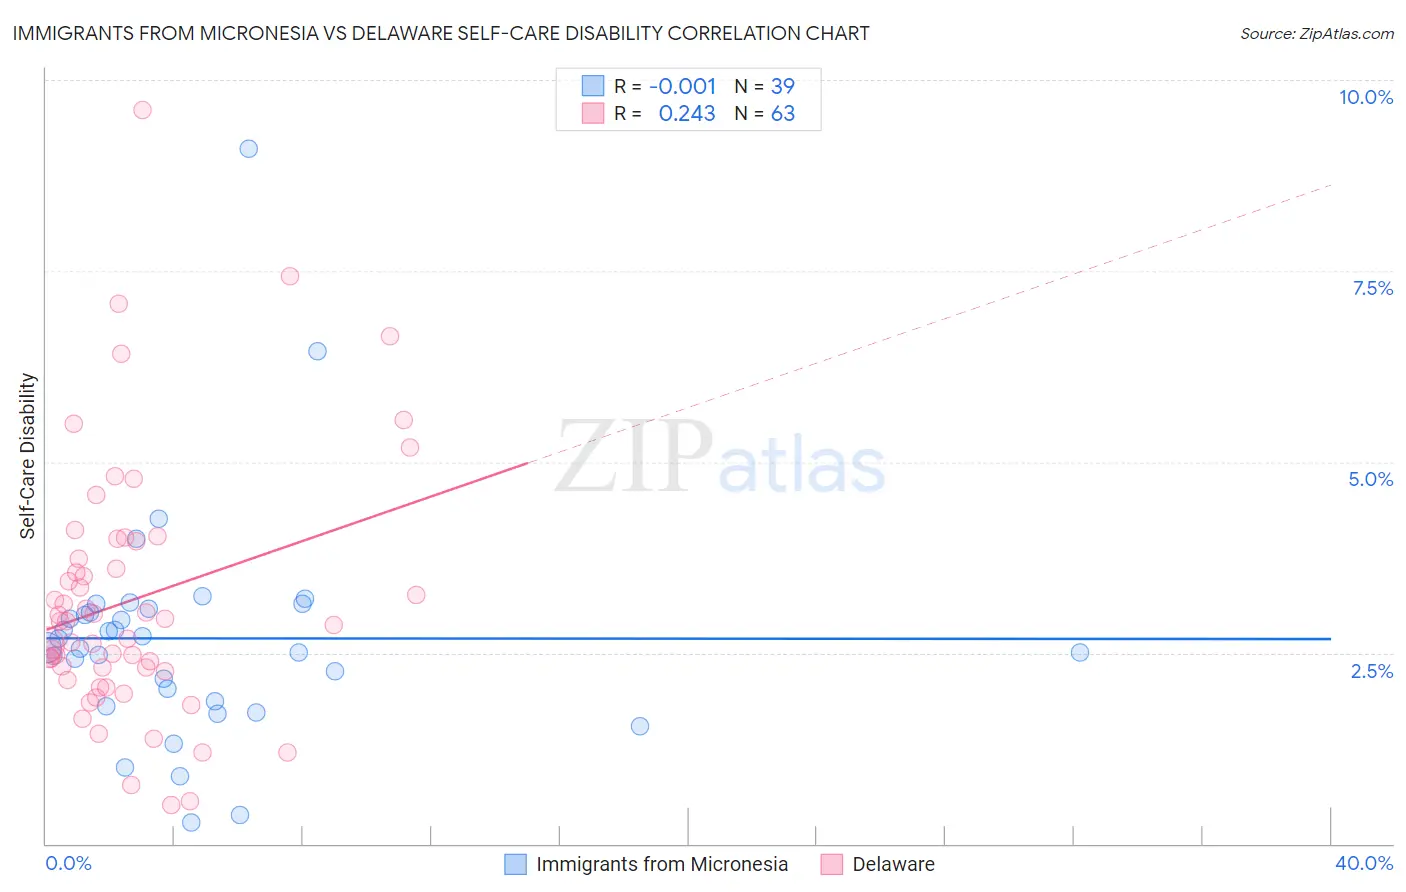
Immigrants from Micronesia vs Delaware Self-Care Disability Correlation Chart
The statistical analysis conducted on geographies consisting of 61,544,733 people shows no correlation between the proportion of Immigrants from Micronesia and percentage of population with self-care disability in the United States with a correlation coefficient (R) of -0.001 and weighted average of 2.7%. Similarly, the statistical analysis conducted on geographies consisting of 96,205,840 people shows a weak positive correlation between the proportion of Delaware and percentage of population with self-care disability in the United States with a correlation coefficient (R) of 0.243 and weighted average of 2.7%, a difference of 0.94%.
Self-Care Disability Correlation Summary
| Measurement | Immigrants from Micronesia | Delaware |
| Minimum | 0.28% | 0.50% |
| Maximum | 9.1% | 9.6% |
| Range | 8.8% | 9.1% |
| Mean | 2.7% | 3.2% |
| Median | 2.6% | 2.9% |
| Interquartile 25% (IQ1) | 1.9% | 2.3% |
| Interquartile 75% (IQ3) | 3.1% | 4.0% |
| Interquartile Range (IQR) | 1.2% | 1.7% |
| Standard Deviation (Sample) | 1.5% | 1.7% |
| Standard Deviation (Population) | 1.5% | 1.7% |
Demographics Similar to Immigrants from Micronesia and Delaware by Self-Care Disability
In terms of self-care disability, the demographic groups most similar to Immigrants from Micronesia are U.S. Virgin Islander (2.7%, a difference of 0.040%), Trinidadian and Tobagonian (2.7%, a difference of 0.060%), Immigrants from Laos (2.7%, a difference of 0.10%), Immigrants from Mexico (2.7%, a difference of 0.21%), and Mexican (2.7%, a difference of 0.24%). Similarly, the demographic groups most similar to Delaware are Fijian (2.7%, a difference of 0.050%), Apache (2.7%, a difference of 0.070%), Jamaican (2.7%, a difference of 0.080%), Immigrants from Iraq (2.7%, a difference of 0.090%), and Hispanic or Latino (2.7%, a difference of 0.25%).
| Demographics | Rating | Rank | Self-Care Disability |
| Immigrants | Cambodia | 0.1 /100 | #266 | Tragic 2.7% |
| Yaqui | 0.1 /100 | #267 | Tragic 2.7% |
| Immigrants | Mexico | 0.1 /100 | #268 | Tragic 2.7% |
| U.S. Virgin Islanders | 0.1 /100 | #269 | Tragic 2.7% |
| Immigrants | Micronesia | 0.1 /100 | #270 | Tragic 2.7% |
| Trinidadians and Tobagonians | 0.1 /100 | #271 | Tragic 2.7% |
| Immigrants | Laos | 0.1 /100 | #272 | Tragic 2.7% |
| Mexicans | 0.1 /100 | #273 | Tragic 2.7% |
| Yakama | 0.1 /100 | #274 | Tragic 2.7% |
| Immigrants | Trinidad and Tobago | 0.1 /100 | #275 | Tragic 2.7% |
| Japanese | 0.1 /100 | #276 | Tragic 2.7% |
| Immigrants | Ukraine | 0.1 /100 | #277 | Tragic 2.7% |
| Ottawa | 0.1 /100 | #278 | Tragic 2.7% |
| Iroquois | 0.1 /100 | #279 | Tragic 2.7% |
| Hispanics or Latinos | 0.1 /100 | #280 | Tragic 2.7% |
| Immigrants | Iraq | 0.0 /100 | #281 | Tragic 2.7% |
| Apache | 0.0 /100 | #282 | Tragic 2.7% |
| Delaware | 0.0 /100 | #283 | Tragic 2.7% |
| Fijians | 0.0 /100 | #284 | Tragic 2.7% |
| Jamaicans | 0.0 /100 | #285 | Tragic 2.7% |
| French American Indians | 0.0 /100 | #286 | Tragic 2.7% |