Immigrants from Micronesia vs Immigrants from Albania Self-Care Disability
COMPARE
Immigrants from Micronesia
Immigrants from Albania
Self-Care Disability
Self-Care Disability Comparison
Immigrants from Micronesia
Immigrants from Albania
2.7%
SELF-CARE DISABILITY
0.1/ 100
METRIC RATING
270th/ 347
METRIC RANK
2.6%
SELF-CARE DISABILITY
0.6/ 100
METRIC RATING
247th/ 347
METRIC RANK
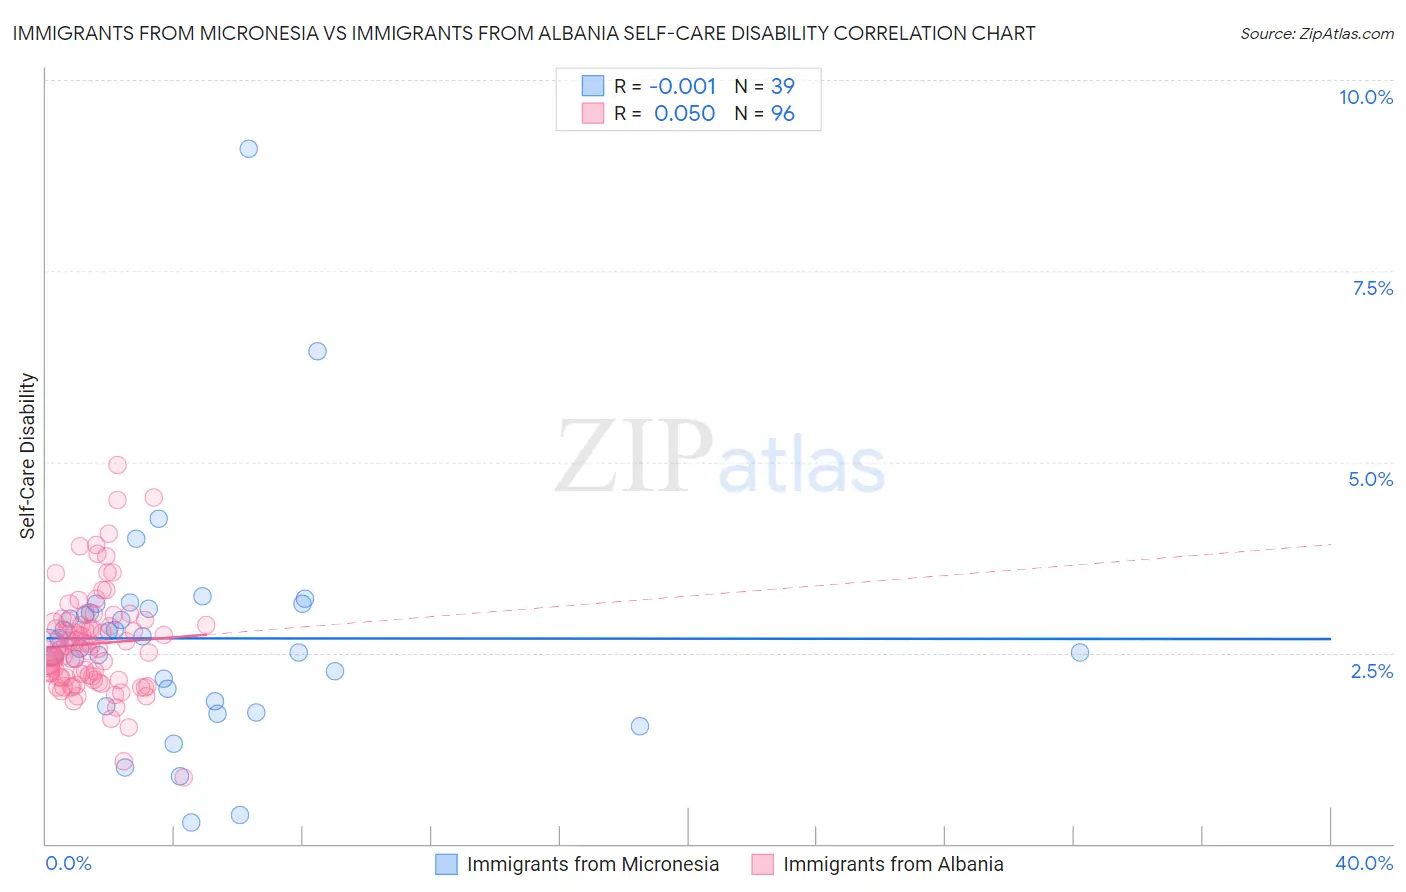
Immigrants from Micronesia vs Immigrants from Albania Self-Care Disability Correlation Chart
The statistical analysis conducted on geographies consisting of 61,544,733 people shows no correlation between the proportion of Immigrants from Micronesia and percentage of population with self-care disability in the United States with a correlation coefficient (R) of -0.001 and weighted average of 2.7%. Similarly, the statistical analysis conducted on geographies consisting of 119,364,841 people shows a slight positive correlation between the proportion of Immigrants from Albania and percentage of population with self-care disability in the United States with a correlation coefficient (R) of 0.050 and weighted average of 2.6%, a difference of 2.0%.
Self-Care Disability Correlation Summary
| Measurement | Immigrants from Micronesia | Immigrants from Albania |
| Minimum | 0.28% | 0.86% |
| Maximum | 9.1% | 5.0% |
| Range | 8.8% | 4.1% |
| Mean | 2.7% | 2.6% |
| Median | 2.6% | 2.5% |
| Interquartile 25% (IQ1) | 1.9% | 2.2% |
| Interquartile 75% (IQ3) | 3.1% | 2.9% |
| Interquartile Range (IQR) | 1.2% | 0.70% |
| Standard Deviation (Sample) | 1.5% | 0.68% |
| Standard Deviation (Population) | 1.5% | 0.67% |
Similar Demographics by Self-Care Disability
Demographics Similar to Immigrants from Micronesia by Self-Care Disability
In terms of self-care disability, the demographic groups most similar to Immigrants from Micronesia are U.S. Virgin Islander (2.7%, a difference of 0.040%), Trinidadian and Tobagonian (2.7%, a difference of 0.060%), Immigrants from Laos (2.7%, a difference of 0.10%), Immigrants from Mexico (2.7%, a difference of 0.21%), and Mexican (2.7%, a difference of 0.24%).
| Demographics | Rating | Rank | Self-Care Disability |
| Immigrants | Latin America | 0.2 /100 | #263 | Tragic 2.7% |
| Immigrants | Iran | 0.2 /100 | #264 | Tragic 2.7% |
| Immigrants | Nicaragua | 0.2 /100 | #265 | Tragic 2.7% |
| Immigrants | Cambodia | 0.1 /100 | #266 | Tragic 2.7% |
| Yaqui | 0.1 /100 | #267 | Tragic 2.7% |
| Immigrants | Mexico | 0.1 /100 | #268 | Tragic 2.7% |
| U.S. Virgin Islanders | 0.1 /100 | #269 | Tragic 2.7% |
| Immigrants | Micronesia | 0.1 /100 | #270 | Tragic 2.7% |
| Trinidadians and Tobagonians | 0.1 /100 | #271 | Tragic 2.7% |
| Immigrants | Laos | 0.1 /100 | #272 | Tragic 2.7% |
| Mexicans | 0.1 /100 | #273 | Tragic 2.7% |
| Yakama | 0.1 /100 | #274 | Tragic 2.7% |
| Immigrants | Trinidad and Tobago | 0.1 /100 | #275 | Tragic 2.7% |
| Japanese | 0.1 /100 | #276 | Tragic 2.7% |
| Immigrants | Ukraine | 0.1 /100 | #277 | Tragic 2.7% |
Demographics Similar to Immigrants from Albania by Self-Care Disability
In terms of self-care disability, the demographic groups most similar to Immigrants from Albania are Nicaraguan (2.6%, a difference of 0.0%), Cheyenne (2.6%, a difference of 0.13%), Immigrants from Western Asia (2.6%, a difference of 0.15%), Mexican American Indian (2.6%, a difference of 0.24%), and Portuguese (2.6%, a difference of 0.32%).
| Demographics | Rating | Rank | Self-Care Disability |
| Marshallese | 1.2 /100 | #240 | Tragic 2.6% |
| Immigrants | Syria | 1.0 /100 | #241 | Tragic 2.6% |
| Spanish | 0.8 /100 | #242 | Tragic 2.6% |
| Hawaiians | 0.8 /100 | #243 | Tragic 2.6% |
| Yuman | 0.8 /100 | #244 | Tragic 2.6% |
| Immigrants | Western Asia | 0.6 /100 | #245 | Tragic 2.6% |
| Cheyenne | 0.6 /100 | #246 | Tragic 2.6% |
| Immigrants | Albania | 0.6 /100 | #247 | Tragic 2.6% |
| Nicaraguans | 0.6 /100 | #248 | Tragic 2.6% |
| Mexican American Indians | 0.5 /100 | #249 | Tragic 2.6% |
| Portuguese | 0.4 /100 | #250 | Tragic 2.6% |
| Immigrants | Liberia | 0.4 /100 | #251 | Tragic 2.6% |
| Immigrants | Bangladesh | 0.4 /100 | #252 | Tragic 2.6% |
| Immigrants | Haiti | 0.3 /100 | #253 | Tragic 2.6% |
| Haitians | 0.3 /100 | #254 | Tragic 2.6% |