Immigrants from Africa vs Immigrants from Uruguay Disability Age 5 to 17
COMPARE
Immigrants from Africa
Immigrants from Uruguay
Disability Age 5 to 17
Disability Age 5 to 17 Comparison
Immigrants from Africa
Immigrants from Uruguay
5.7%
DISABILITY AGE 5 TO 17
10.8/ 100
METRIC RATING
206th/ 347
METRIC RANK
5.6%
DISABILITY AGE 5 TO 17
37.7/ 100
METRIC RATING
180th/ 347
METRIC RANK
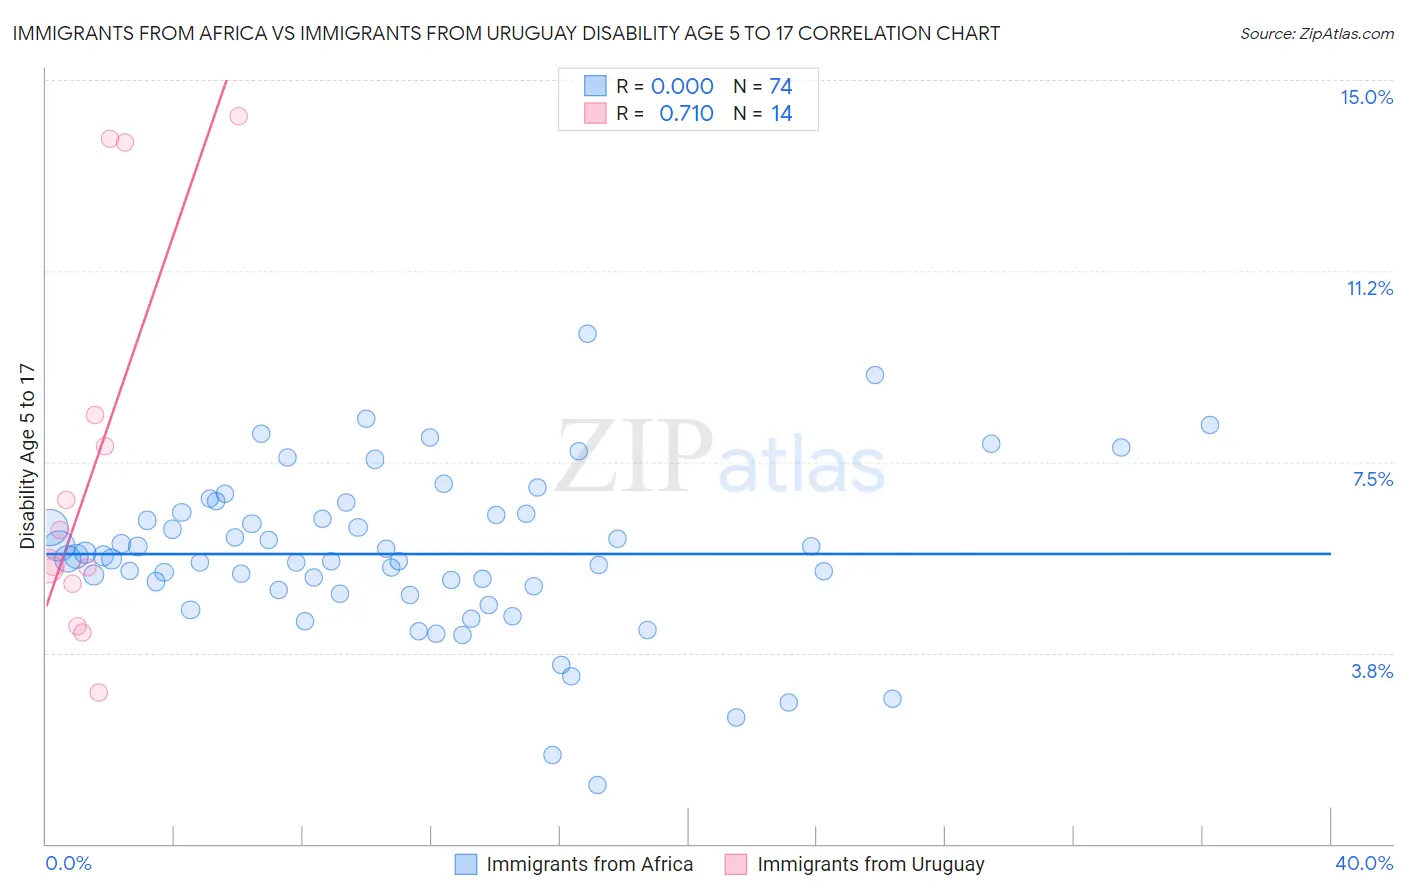
Immigrants from Africa vs Immigrants from Uruguay Disability Age 5 to 17 Correlation Chart
The statistical analysis conducted on geographies consisting of 464,573,115 people shows no correlation between the proportion of Immigrants from Africa and percentage of population with a disability between the ages 5 and 17 in the United States with a correlation coefficient (R) of 0.000 and weighted average of 5.7%. Similarly, the statistical analysis conducted on geographies consisting of 132,989,103 people shows a strong positive correlation between the proportion of Immigrants from Uruguay and percentage of population with a disability between the ages 5 and 17 in the United States with a correlation coefficient (R) of 0.710 and weighted average of 5.6%, a difference of 2.0%.
Disability Age 5 to 17 Correlation Summary
| Measurement | Immigrants from Africa | Immigrants from Uruguay |
| Minimum | 1.2% | 3.0% |
| Maximum | 10.0% | 14.3% |
| Range | 8.9% | 11.3% |
| Mean | 5.7% | 7.4% |
| Median | 5.6% | 5.8% |
| Interquartile 25% (IQ1) | 5.0% | 5.1% |
| Interquartile 75% (IQ3) | 6.5% | 8.4% |
| Interquartile Range (IQR) | 1.5% | 3.3% |
| Standard Deviation (Sample) | 1.6% | 3.8% |
| Standard Deviation (Population) | 1.6% | 3.7% |
Similar Demographics by Disability Age 5 to 17
Demographics Similar to Immigrants from Africa by Disability Age 5 to 17
In terms of disability age 5 to 17, the demographic groups most similar to Immigrants from Africa are Trinidadian and Tobagonian (5.7%, a difference of 0.0%), Moroccan (5.7%, a difference of 0.050%), Paiute (5.7%, a difference of 0.060%), Kenyan (5.8%, a difference of 0.10%), and Immigrants from Uganda (5.8%, a difference of 0.14%).
| Demographics | Rating | Rank | Disability Age 5 to 17 |
| Northern Europeans | 15.2 /100 | #199 | Poor 5.7% |
| Icelanders | 14.6 /100 | #200 | Poor 5.7% |
| Basques | 13.7 /100 | #201 | Poor 5.7% |
| Austrians | 13.2 /100 | #202 | Poor 5.7% |
| Spanish American Indians | 12.8 /100 | #203 | Poor 5.7% |
| Paiute | 11.2 /100 | #204 | Poor 5.7% |
| Trinidadians and Tobagonians | 10.8 /100 | #205 | Poor 5.7% |
| Immigrants | Africa | 10.8 /100 | #206 | Poor 5.7% |
| Moroccans | 10.4 /100 | #207 | Poor 5.7% |
| Kenyans | 10.0 /100 | #208 | Poor 5.8% |
| Immigrants | Uganda | 9.7 /100 | #209 | Tragic 5.8% |
| Immigrants | Haiti | 9.5 /100 | #210 | Tragic 5.8% |
| Yugoslavians | 9.1 /100 | #211 | Tragic 5.8% |
| Immigrants | Panama | 8.7 /100 | #212 | Tragic 5.8% |
| Immigrants | Cameroon | 8.3 /100 | #213 | Tragic 5.8% |
Demographics Similar to Immigrants from Uruguay by Disability Age 5 to 17
In terms of disability age 5 to 17, the demographic groups most similar to Immigrants from Uruguay are Immigrants from England (5.6%, a difference of 0.070%), Mexican American Indian (5.6%, a difference of 0.13%), Immigrants from Barbados (5.6%, a difference of 0.14%), Immigrants from Latin America (5.6%, a difference of 0.18%), and Syrian (5.6%, a difference of 0.21%).
| Demographics | Rating | Rank | Disability Age 5 to 17 |
| Uruguayans | 51.0 /100 | #173 | Average 5.6% |
| Costa Ricans | 50.0 /100 | #174 | Average 5.6% |
| Shoshone | 49.4 /100 | #175 | Average 5.6% |
| Immigrants | Central America | 49.4 /100 | #176 | Average 5.6% |
| Immigrants | Western Europe | 47.8 /100 | #177 | Average 5.6% |
| Immigrants | Trinidad and Tobago | 47.6 /100 | #178 | Average 5.6% |
| Immigrants | Barbados | 40.5 /100 | #179 | Average 5.6% |
| Immigrants | Uruguay | 37.7 /100 | #180 | Fair 5.6% |
| Immigrants | England | 36.4 /100 | #181 | Fair 5.6% |
| Mexican American Indians | 35.2 /100 | #182 | Fair 5.6% |
| Immigrants | Latin America | 34.3 /100 | #183 | Fair 5.6% |
| Syrians | 33.8 /100 | #184 | Fair 5.6% |
| Immigrants | Mexico | 33.7 /100 | #185 | Fair 5.6% |
| Fijians | 31.7 /100 | #186 | Fair 5.7% |
| Immigrants | Thailand | 30.2 /100 | #187 | Fair 5.7% |