Immigrants from Jamaica vs Hawaiian Disability
COMPARE
Immigrants from Jamaica
Hawaiian
Disability
Disability Comparison
Immigrants from Jamaica
Hawaiians
12.1%
DISABILITY
5.0/ 100
METRIC RATING
218th/ 347
METRIC RANK
12.5%
DISABILITY
0.2/ 100
METRIC RATING
263rd/ 347
METRIC RANK
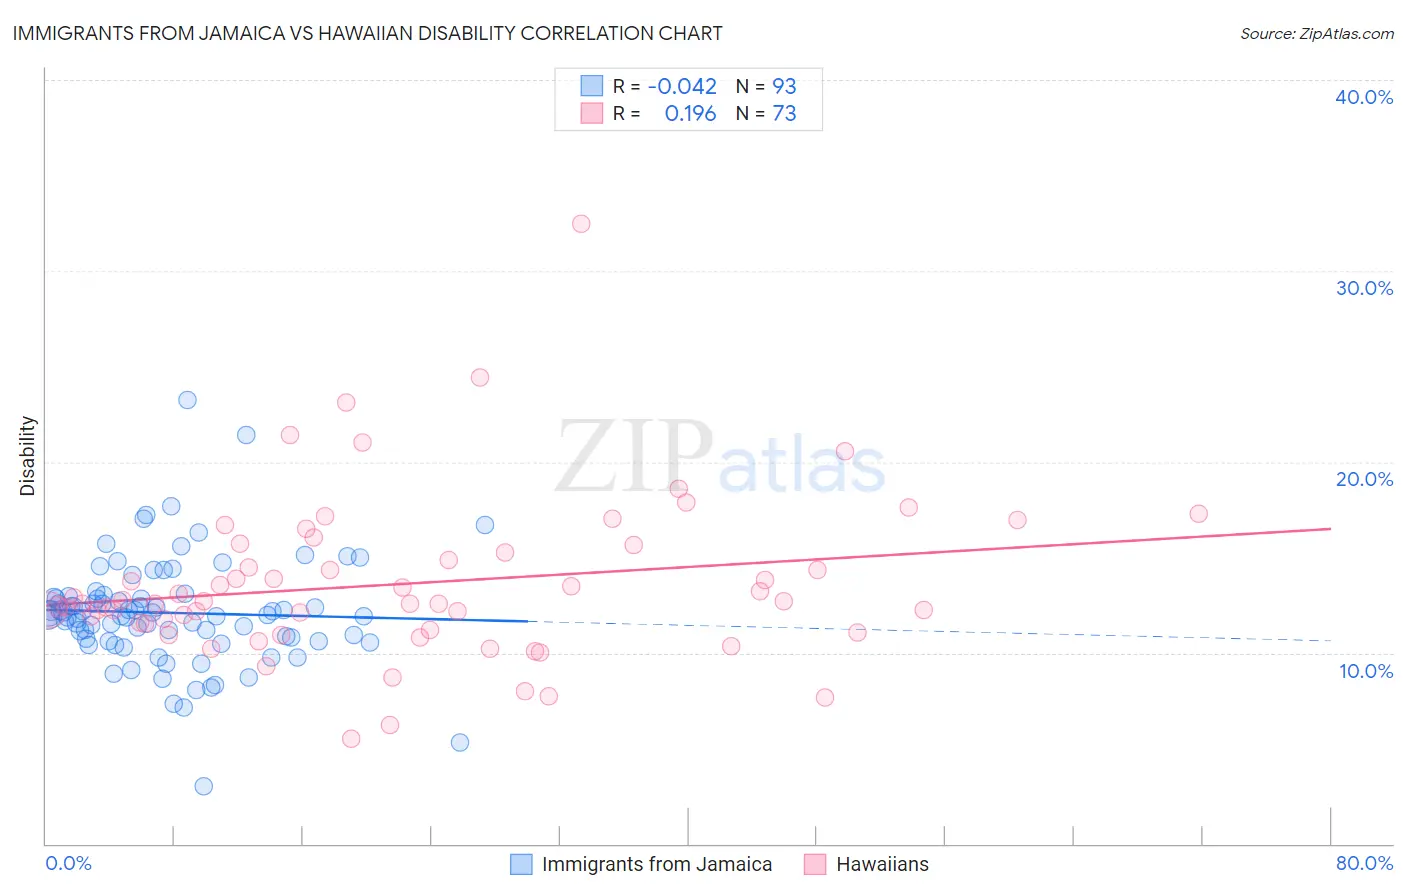
Immigrants from Jamaica vs Hawaiian Disability Correlation Chart
The statistical analysis conducted on geographies consisting of 301,749,565 people shows no correlation between the proportion of Immigrants from Jamaica and percentage of population with a disability in the United States with a correlation coefficient (R) of -0.042 and weighted average of 12.1%. Similarly, the statistical analysis conducted on geographies consisting of 327,510,091 people shows a poor positive correlation between the proportion of Hawaiians and percentage of population with a disability in the United States with a correlation coefficient (R) of 0.196 and weighted average of 12.5%, a difference of 3.3%.
Disability Correlation Summary
| Measurement | Immigrants from Jamaica | Hawaiian |
| Minimum | 3.0% | 5.5% |
| Maximum | 23.2% | 32.5% |
| Range | 20.2% | 27.0% |
| Mean | 12.1% | 13.6% |
| Median | 12.0% | 12.6% |
| Interquartile 25% (IQ1) | 10.7% | 11.4% |
| Interquartile 75% (IQ3) | 12.9% | 15.5% |
| Interquartile Range (IQR) | 2.3% | 4.1% |
| Standard Deviation (Sample) | 2.9% | 4.2% |
| Standard Deviation (Population) | 2.9% | 4.2% |
Similar Demographics by Disability
Demographics Similar to Immigrants from Jamaica by Disability
In terms of disability, the demographic groups most similar to Immigrants from Jamaica are Croatian (12.1%, a difference of 0.040%), Immigrants from North America (12.1%, a difference of 0.060%), Panamanian (12.1%, a difference of 0.070%), Immigrants from Bahamas (12.1%, a difference of 0.080%), and Northern European (12.1%, a difference of 0.20%).
| Demographics | Rating | Rank | Disability |
| Immigrants | Cambodia | 7.3 /100 | #211 | Tragic 12.0% |
| Austrians | 7.2 /100 | #212 | Tragic 12.0% |
| Immigrants | Iraq | 7.1 /100 | #213 | Tragic 12.0% |
| Immigrants | Somalia | 6.8 /100 | #214 | Tragic 12.0% |
| Immigrants | Canada | 6.1 /100 | #215 | Tragic 12.1% |
| Panamanians | 5.4 /100 | #216 | Tragic 12.1% |
| Immigrants | North America | 5.3 /100 | #217 | Tragic 12.1% |
| Immigrants | Jamaica | 5.0 /100 | #218 | Tragic 12.1% |
| Croatians | 4.9 /100 | #219 | Tragic 12.1% |
| Immigrants | Bahamas | 4.7 /100 | #220 | Tragic 12.1% |
| Northern Europeans | 4.2 /100 | #221 | Tragic 12.1% |
| Spanish American Indians | 4.1 /100 | #222 | Tragic 12.1% |
| Hispanics or Latinos | 3.9 /100 | #223 | Tragic 12.1% |
| Mexicans | 3.7 /100 | #224 | Tragic 12.1% |
| Senegalese | 3.5 /100 | #225 | Tragic 12.1% |
Demographics Similar to Hawaiians by Disability
In terms of disability, the demographic groups most similar to Hawaiians are Immigrants from Germany (12.5%, a difference of 0.11%), U.S. Virgin Islander (12.5%, a difference of 0.13%), Native Hawaiian (12.5%, a difference of 0.20%), Czechoslovakian (12.5%, a difference of 0.29%), and Spaniard (12.5%, a difference of 0.37%).
| Demographics | Rating | Rank | Disability |
| Immigrants | Dominica | 0.6 /100 | #256 | Tragic 12.4% |
| Immigrants | Laos | 0.5 /100 | #257 | Tragic 12.4% |
| Slavs | 0.5 /100 | #258 | Tragic 12.4% |
| Canadians | 0.4 /100 | #259 | Tragic 12.4% |
| Immigrants | Liberia | 0.4 /100 | #260 | Tragic 12.4% |
| Scandinavians | 0.4 /100 | #261 | Tragic 12.4% |
| Native Hawaiians | 0.3 /100 | #262 | Tragic 12.5% |
| Hawaiians | 0.2 /100 | #263 | Tragic 12.5% |
| Immigrants | Germany | 0.2 /100 | #264 | Tragic 12.5% |
| U.S. Virgin Islanders | 0.2 /100 | #265 | Tragic 12.5% |
| Czechoslovakians | 0.2 /100 | #266 | Tragic 12.5% |
| Spaniards | 0.2 /100 | #267 | Tragic 12.5% |
| Bangladeshis | 0.1 /100 | #268 | Tragic 12.6% |
| Immigrants | Dominican Republic | 0.1 /100 | #269 | Tragic 12.6% |
| Portuguese | 0.1 /100 | #270 | Tragic 12.6% |