Norwegian vs Hawaiian Disability
COMPARE
Norwegian
Hawaiian
Disability
Disability Comparison
Norwegians
Hawaiians
12.2%
DISABILITY
1.9/ 100
METRIC RATING
238th/ 347
METRIC RANK
12.5%
DISABILITY
0.2/ 100
METRIC RATING
263rd/ 347
METRIC RANK
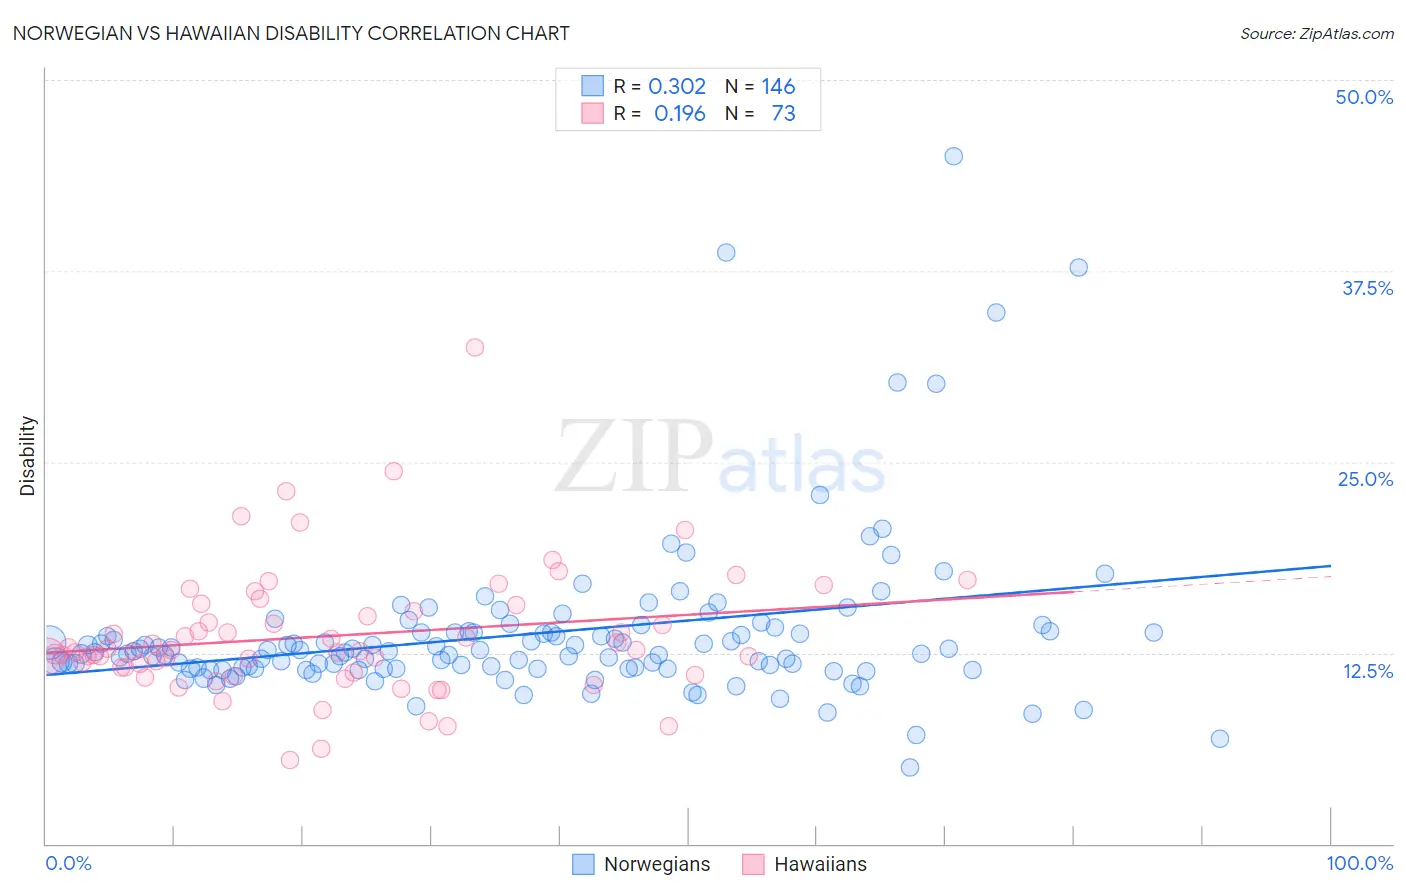
Norwegian vs Hawaiian Disability Correlation Chart
The statistical analysis conducted on geographies consisting of 533,272,047 people shows a mild positive correlation between the proportion of Norwegians and percentage of population with a disability in the United States with a correlation coefficient (R) of 0.302 and weighted average of 12.2%. Similarly, the statistical analysis conducted on geographies consisting of 327,510,091 people shows a poor positive correlation between the proportion of Hawaiians and percentage of population with a disability in the United States with a correlation coefficient (R) of 0.196 and weighted average of 12.5%, a difference of 2.1%.
Disability Correlation Summary
| Measurement | Norwegian | Hawaiian |
| Minimum | 5.0% | 5.5% |
| Maximum | 45.0% | 32.5% |
| Range | 40.0% | 27.0% |
| Mean | 13.7% | 13.6% |
| Median | 12.5% | 12.6% |
| Interquartile 25% (IQ1) | 11.5% | 11.4% |
| Interquartile 75% (IQ3) | 13.8% | 15.5% |
| Interquartile Range (IQR) | 2.3% | 4.1% |
| Standard Deviation (Sample) | 5.4% | 4.2% |
| Standard Deviation (Population) | 5.3% | 4.2% |
Similar Demographics by Disability
Demographics Similar to Norwegians by Disability
In terms of disability, the demographic groups most similar to Norwegians are Immigrants from Congo (12.2%, a difference of 0.040%), Swedish (12.2%, a difference of 0.040%), Chinese (12.2%, a difference of 0.090%), Hungarian (12.2%, a difference of 0.090%), and Yugoslavian (12.2%, a difference of 0.090%).
| Demographics | Rating | Rank | Disability |
| Malaysians | 2.5 /100 | #231 | Tragic 12.2% |
| Italians | 2.5 /100 | #232 | Tragic 12.2% |
| Bahamians | 2.3 /100 | #233 | Tragic 12.2% |
| Japanese | 2.3 /100 | #234 | Tragic 12.2% |
| Yup'ik | 2.2 /100 | #235 | Tragic 12.2% |
| Chinese | 2.0 /100 | #236 | Tragic 12.2% |
| Immigrants | Congo | 1.9 /100 | #237 | Tragic 12.2% |
| Norwegians | 1.9 /100 | #238 | Tragic 12.2% |
| Swedes | 1.8 /100 | #239 | Tragic 12.2% |
| Hungarians | 1.7 /100 | #240 | Tragic 12.2% |
| Yugoslavians | 1.7 /100 | #241 | Tragic 12.2% |
| Poles | 1.7 /100 | #242 | Tragic 12.2% |
| British | 1.5 /100 | #243 | Tragic 12.2% |
| Basques | 1.5 /100 | #244 | Tragic 12.2% |
| Liberians | 1.5 /100 | #245 | Tragic 12.2% |
Demographics Similar to Hawaiians by Disability
In terms of disability, the demographic groups most similar to Hawaiians are Immigrants from Germany (12.5%, a difference of 0.11%), U.S. Virgin Islander (12.5%, a difference of 0.13%), Native Hawaiian (12.5%, a difference of 0.20%), Czechoslovakian (12.5%, a difference of 0.29%), and Spaniard (12.5%, a difference of 0.37%).
| Demographics | Rating | Rank | Disability |
| Immigrants | Dominica | 0.6 /100 | #256 | Tragic 12.4% |
| Immigrants | Laos | 0.5 /100 | #257 | Tragic 12.4% |
| Slavs | 0.5 /100 | #258 | Tragic 12.4% |
| Canadians | 0.4 /100 | #259 | Tragic 12.4% |
| Immigrants | Liberia | 0.4 /100 | #260 | Tragic 12.4% |
| Scandinavians | 0.4 /100 | #261 | Tragic 12.4% |
| Native Hawaiians | 0.3 /100 | #262 | Tragic 12.5% |
| Hawaiians | 0.2 /100 | #263 | Tragic 12.5% |
| Immigrants | Germany | 0.2 /100 | #264 | Tragic 12.5% |
| U.S. Virgin Islanders | 0.2 /100 | #265 | Tragic 12.5% |
| Czechoslovakians | 0.2 /100 | #266 | Tragic 12.5% |
| Spaniards | 0.2 /100 | #267 | Tragic 12.5% |
| Bangladeshis | 0.1 /100 | #268 | Tragic 12.6% |
| Immigrants | Dominican Republic | 0.1 /100 | #269 | Tragic 12.6% |
| Portuguese | 0.1 /100 | #270 | Tragic 12.6% |