Spanish vs Hawaiian Disability
COMPARE
Spanish
Hawaiian
Disability
Disability Comparison
Spanish
Hawaiians
12.8%
DISABILITY
0.0/ 100
METRIC RATING
280th/ 347
METRIC RANK
12.5%
DISABILITY
0.2/ 100
METRIC RATING
263rd/ 347
METRIC RANK
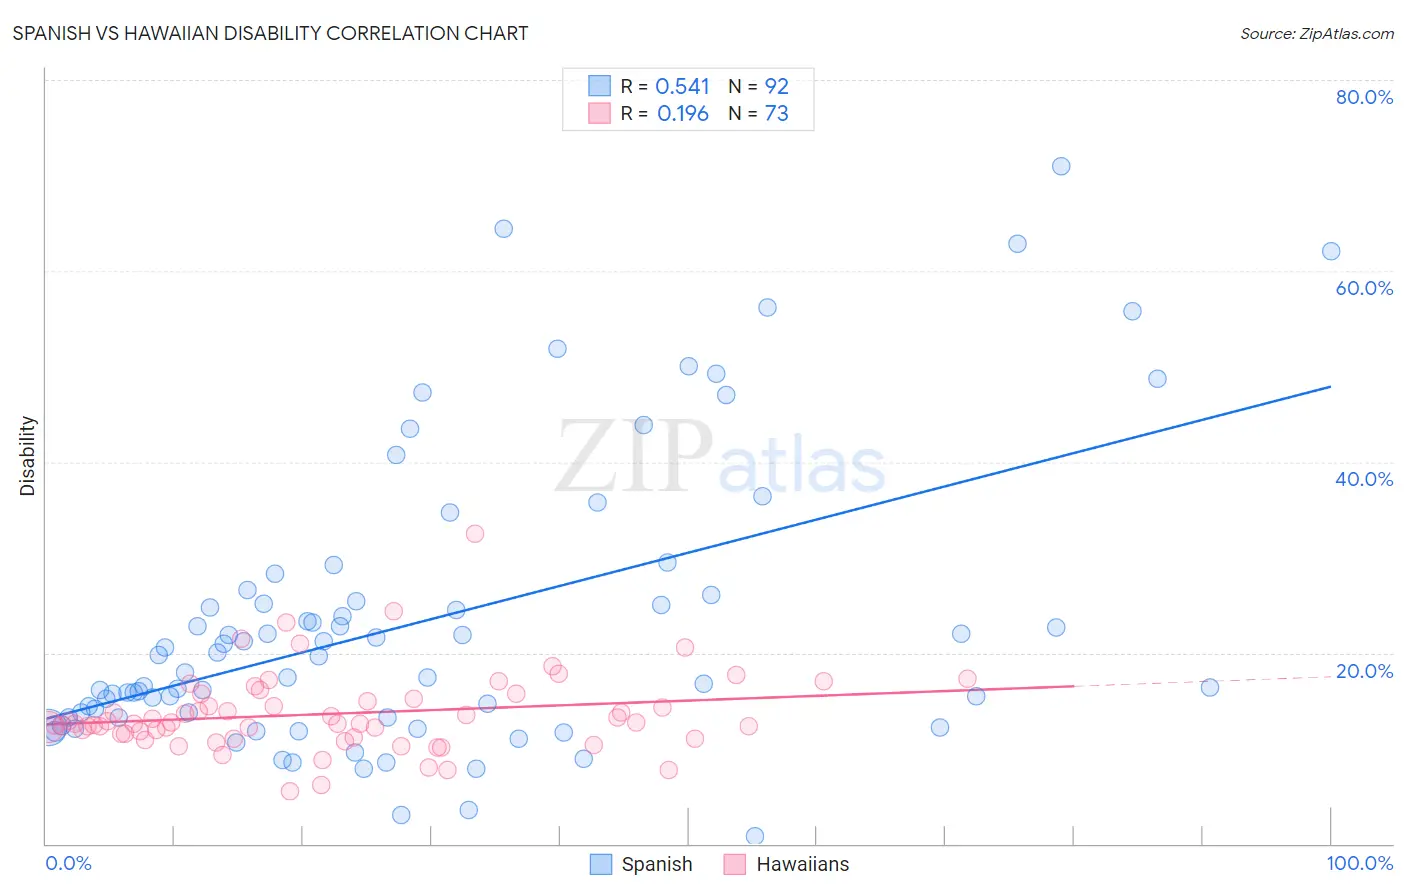
Spanish vs Hawaiian Disability Correlation Chart
The statistical analysis conducted on geographies consisting of 422,113,080 people shows a substantial positive correlation between the proportion of Spanish and percentage of population with a disability in the United States with a correlation coefficient (R) of 0.541 and weighted average of 12.8%. Similarly, the statistical analysis conducted on geographies consisting of 327,510,091 people shows a poor positive correlation between the proportion of Hawaiians and percentage of population with a disability in the United States with a correlation coefficient (R) of 0.196 and weighted average of 12.5%, a difference of 2.9%.
Disability Correlation Summary
| Measurement | Spanish | Hawaiian |
| Minimum | 0.84% | 5.5% |
| Maximum | 71.0% | 32.5% |
| Range | 70.1% | 27.0% |
| Mean | 23.3% | 13.6% |
| Median | 18.8% | 12.6% |
| Interquartile 25% (IQ1) | 13.2% | 11.4% |
| Interquartile 75% (IQ3) | 25.7% | 15.5% |
| Interquartile Range (IQR) | 12.5% | 4.1% |
| Standard Deviation (Sample) | 15.1% | 4.2% |
| Standard Deviation (Population) | 15.0% | 4.2% |
Demographics Similar to Spanish and Hawaiians by Disability
In terms of disability, the demographic groups most similar to Spanish are Fijian (12.8%, a difference of 0.050%), Immigrants from Portugal (12.9%, a difference of 0.14%), German (12.8%, a difference of 0.15%), Dutch (12.8%, a difference of 0.31%), and Hmong (12.8%, a difference of 0.36%). Similarly, the demographic groups most similar to Hawaiians are Immigrants from Germany (12.5%, a difference of 0.11%), U.S. Virgin Islander (12.5%, a difference of 0.13%), Native Hawaiian (12.5%, a difference of 0.20%), Czechoslovakian (12.5%, a difference of 0.29%), and Spaniard (12.5%, a difference of 0.37%).
| Demographics | Rating | Rank | Disability |
| Scandinavians | 0.4 /100 | #261 | Tragic 12.4% |
| Native Hawaiians | 0.3 /100 | #262 | Tragic 12.5% |
| Hawaiians | 0.2 /100 | #263 | Tragic 12.5% |
| Immigrants | Germany | 0.2 /100 | #264 | Tragic 12.5% |
| U.S. Virgin Islanders | 0.2 /100 | #265 | Tragic 12.5% |
| Czechoslovakians | 0.2 /100 | #266 | Tragic 12.5% |
| Spaniards | 0.2 /100 | #267 | Tragic 12.5% |
| Bangladeshis | 0.1 /100 | #268 | Tragic 12.6% |
| Immigrants | Dominican Republic | 0.1 /100 | #269 | Tragic 12.6% |
| Portuguese | 0.1 /100 | #270 | Tragic 12.6% |
| Immigrants | Yemen | 0.1 /100 | #271 | Tragic 12.6% |
| Dominicans | 0.0 /100 | #272 | Tragic 12.7% |
| Finns | 0.0 /100 | #273 | Tragic 12.7% |
| Nepalese | 0.0 /100 | #274 | Tragic 12.8% |
| Sioux | 0.0 /100 | #275 | Tragic 12.8% |
| Hmong | 0.0 /100 | #276 | Tragic 12.8% |
| Dutch | 0.0 /100 | #277 | Tragic 12.8% |
| Germans | 0.0 /100 | #278 | Tragic 12.8% |
| Fijians | 0.0 /100 | #279 | Tragic 12.8% |
| Spanish | 0.0 /100 | #280 | Tragic 12.8% |
| Immigrants | Portugal | 0.0 /100 | #281 | Tragic 12.9% |