Chippewa vs Hawaiian Disability
COMPARE
Chippewa
Hawaiian
Disability
Disability Comparison
Chippewa
Hawaiians
14.1%
DISABILITY
0.0/ 100
METRIC RATING
324th/ 347
METRIC RANK
12.5%
DISABILITY
0.2/ 100
METRIC RATING
263rd/ 347
METRIC RANK
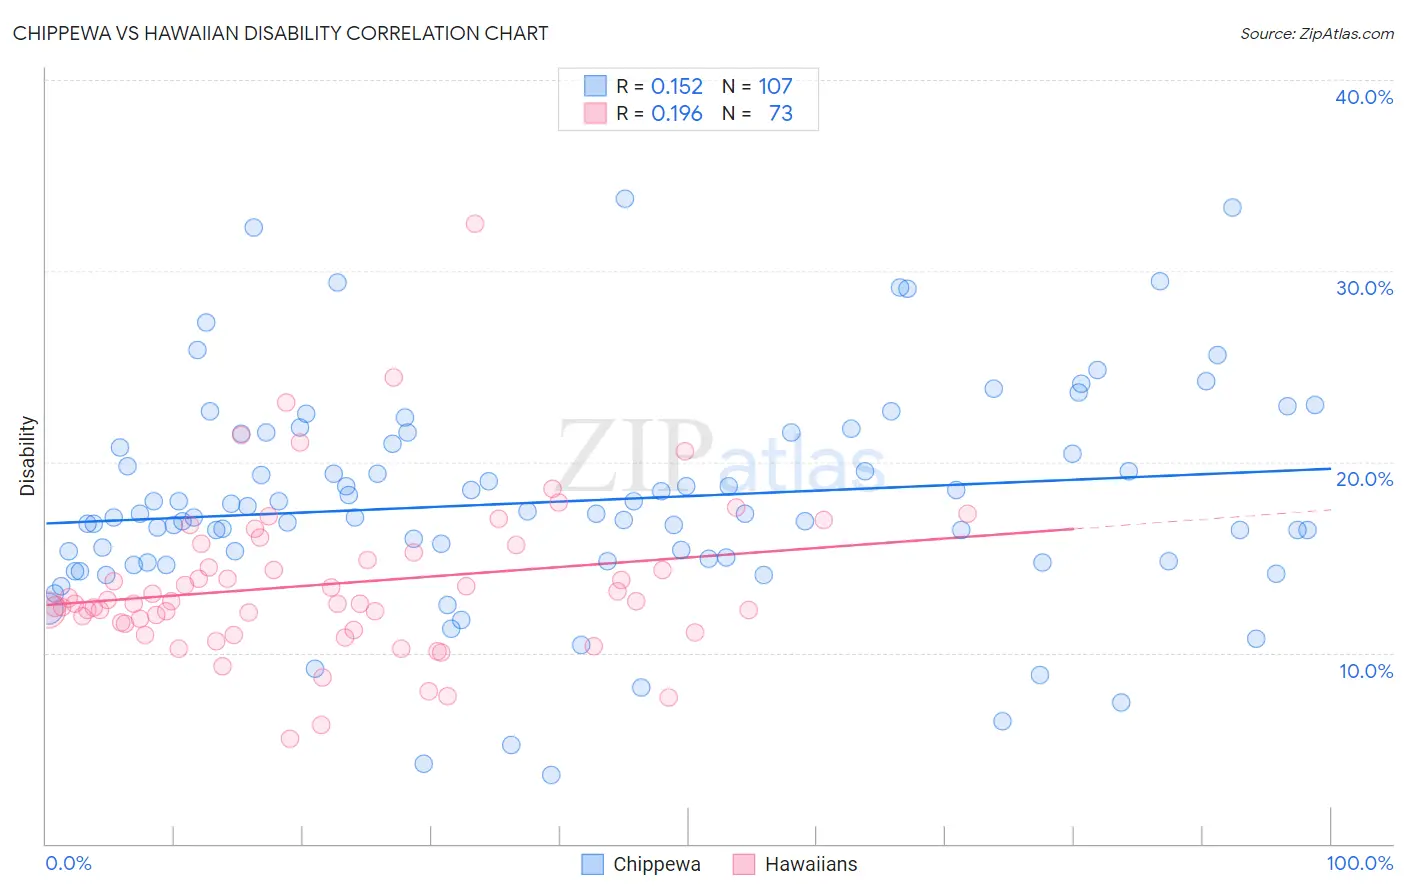
Chippewa vs Hawaiian Disability Correlation Chart
The statistical analysis conducted on geographies consisting of 215,047,919 people shows a poor positive correlation between the proportion of Chippewa and percentage of population with a disability in the United States with a correlation coefficient (R) of 0.152 and weighted average of 14.1%. Similarly, the statistical analysis conducted on geographies consisting of 327,510,091 people shows a poor positive correlation between the proportion of Hawaiians and percentage of population with a disability in the United States with a correlation coefficient (R) of 0.196 and weighted average of 12.5%, a difference of 13.4%.
Disability Correlation Summary
| Measurement | Chippewa | Hawaiian |
| Minimum | 3.6% | 5.5% |
| Maximum | 33.8% | 32.5% |
| Range | 30.2% | 27.0% |
| Mean | 17.9% | 13.6% |
| Median | 17.3% | 12.6% |
| Interquartile 25% (IQ1) | 14.8% | 11.4% |
| Interquartile 75% (IQ3) | 21.5% | 15.5% |
| Interquartile Range (IQR) | 6.7% | 4.1% |
| Standard Deviation (Sample) | 5.7% | 4.2% |
| Standard Deviation (Population) | 5.7% | 4.2% |
Similar Demographics by Disability
Demographics Similar to Chippewa by Disability
In terms of disability, the demographic groups most similar to Chippewa are Native/Alaskan (14.2%, a difference of 0.050%), Osage (14.2%, a difference of 0.080%), Ottawa (14.2%, a difference of 0.10%), Immigrants from the Azores (14.2%, a difference of 0.10%), and Comanche (14.1%, a difference of 0.20%).
| Demographics | Rating | Rank | Disability |
| Immigrants | Cabo Verde | 0.0 /100 | #317 | Tragic 13.7% |
| Menominee | 0.0 /100 | #318 | Tragic 13.8% |
| Iroquois | 0.0 /100 | #319 | Tragic 13.8% |
| Apache | 0.0 /100 | #320 | Tragic 13.9% |
| Paiute | 0.0 /100 | #321 | Tragic 13.9% |
| Americans | 0.0 /100 | #322 | Tragic 13.9% |
| Comanche | 0.0 /100 | #323 | Tragic 14.1% |
| Chippewa | 0.0 /100 | #324 | Tragic 14.1% |
| Natives/Alaskans | 0.0 /100 | #325 | Tragic 14.2% |
| Osage | 0.0 /100 | #326 | Tragic 14.2% |
| Ottawa | 0.0 /100 | #327 | Tragic 14.2% |
| Immigrants | Azores | 0.0 /100 | #328 | Tragic 14.2% |
| Potawatomi | 0.0 /100 | #329 | Tragic 14.2% |
| Navajo | 0.0 /100 | #330 | Tragic 14.3% |
| Alaskan Athabascans | 0.0 /100 | #331 | Tragic 14.4% |
Demographics Similar to Hawaiians by Disability
In terms of disability, the demographic groups most similar to Hawaiians are Immigrants from Germany (12.5%, a difference of 0.11%), U.S. Virgin Islander (12.5%, a difference of 0.13%), Native Hawaiian (12.5%, a difference of 0.20%), Czechoslovakian (12.5%, a difference of 0.29%), and Spaniard (12.5%, a difference of 0.37%).
| Demographics | Rating | Rank | Disability |
| Immigrants | Dominica | 0.6 /100 | #256 | Tragic 12.4% |
| Immigrants | Laos | 0.5 /100 | #257 | Tragic 12.4% |
| Slavs | 0.5 /100 | #258 | Tragic 12.4% |
| Canadians | 0.4 /100 | #259 | Tragic 12.4% |
| Immigrants | Liberia | 0.4 /100 | #260 | Tragic 12.4% |
| Scandinavians | 0.4 /100 | #261 | Tragic 12.4% |
| Native Hawaiians | 0.3 /100 | #262 | Tragic 12.5% |
| Hawaiians | 0.2 /100 | #263 | Tragic 12.5% |
| Immigrants | Germany | 0.2 /100 | #264 | Tragic 12.5% |
| U.S. Virgin Islanders | 0.2 /100 | #265 | Tragic 12.5% |
| Czechoslovakians | 0.2 /100 | #266 | Tragic 12.5% |
| Spaniards | 0.2 /100 | #267 | Tragic 12.5% |
| Bangladeshis | 0.1 /100 | #268 | Tragic 12.6% |
| Immigrants | Dominican Republic | 0.1 /100 | #269 | Tragic 12.6% |
| Portuguese | 0.1 /100 | #270 | Tragic 12.6% |