Immigrants from Jamaica vs Immigrants from Panama Disability
COMPARE
Immigrants from Jamaica
Immigrants from Panama
Disability
Disability Comparison
Immigrants from Jamaica
Immigrants from Panama
12.1%
DISABILITY
5.0/ 100
METRIC RATING
218th/ 347
METRIC RANK
11.9%
DISABILITY
14.6/ 100
METRIC RATING
199th/ 347
METRIC RANK
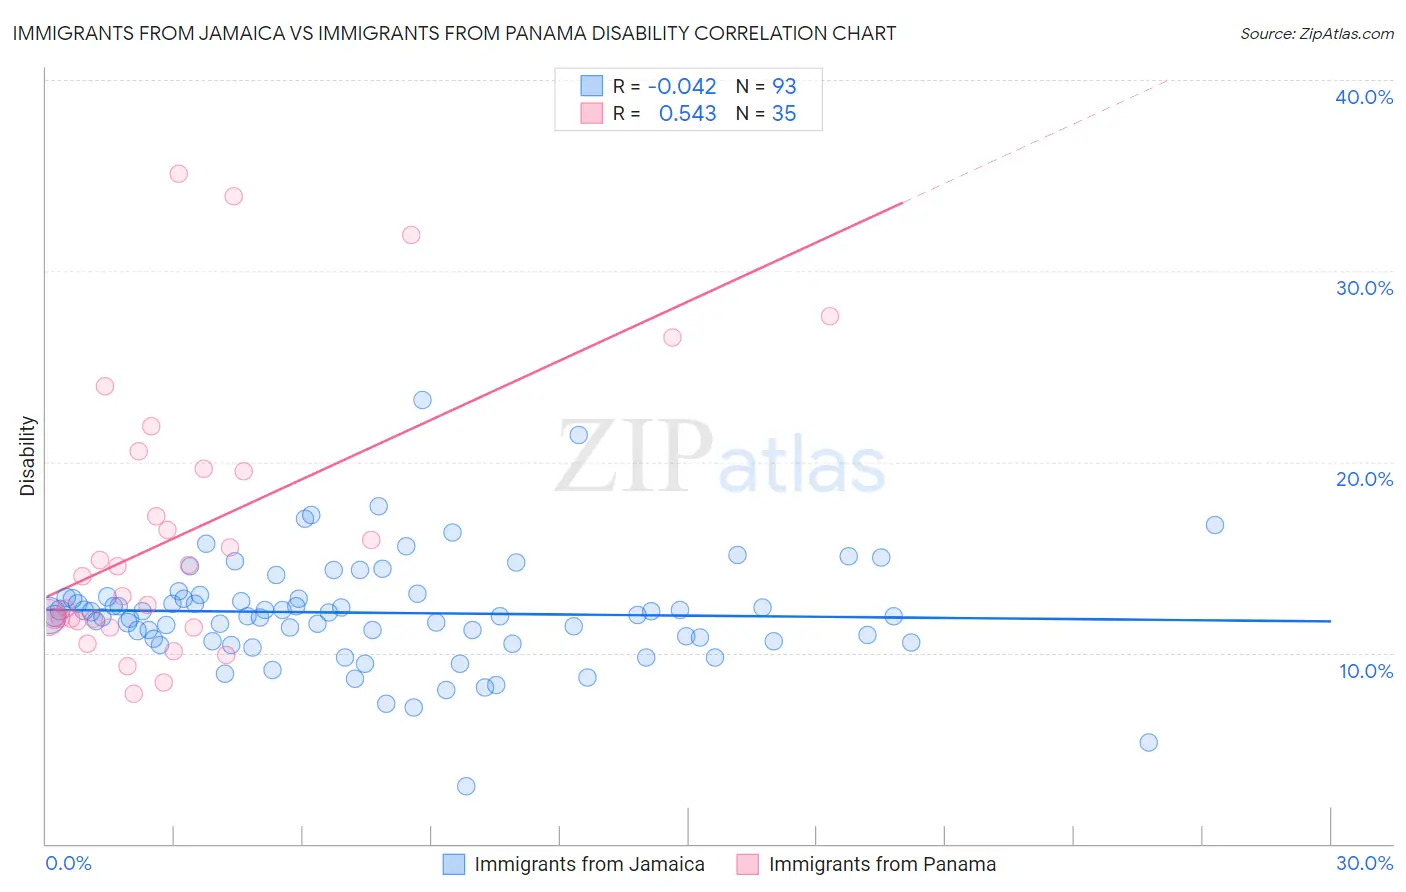
Immigrants from Jamaica vs Immigrants from Panama Disability Correlation Chart
The statistical analysis conducted on geographies consisting of 301,749,565 people shows no correlation between the proportion of Immigrants from Jamaica and percentage of population with a disability in the United States with a correlation coefficient (R) of -0.042 and weighted average of 12.1%. Similarly, the statistical analysis conducted on geographies consisting of 221,178,706 people shows a substantial positive correlation between the proportion of Immigrants from Panama and percentage of population with a disability in the United States with a correlation coefficient (R) of 0.543 and weighted average of 11.9%, a difference of 1.3%.
Disability Correlation Summary
| Measurement | Immigrants from Jamaica | Immigrants from Panama |
| Minimum | 3.0% | 7.9% |
| Maximum | 23.2% | 35.1% |
| Range | 20.2% | 27.2% |
| Mean | 12.1% | 16.3% |
| Median | 12.0% | 14.0% |
| Interquartile 25% (IQ1) | 10.7% | 11.7% |
| Interquartile 75% (IQ3) | 12.9% | 19.7% |
| Interquartile Range (IQR) | 2.3% | 8.0% |
| Standard Deviation (Sample) | 2.9% | 7.3% |
| Standard Deviation (Population) | 2.9% | 7.2% |
Demographics Similar to Immigrants from Jamaica and Immigrants from Panama by Disability
In terms of disability, the demographic groups most similar to Immigrants from Jamaica are Immigrants from North America (12.1%, a difference of 0.060%), Panamanian (12.1%, a difference of 0.070%), Immigrants from Canada (12.1%, a difference of 0.22%), Immigrants from Somalia (12.0%, a difference of 0.35%), and Austrian (12.0%, a difference of 0.40%). Similarly, the demographic groups most similar to Immigrants from Panama are Ukrainian (11.9%, a difference of 0.010%), Belizean (11.9%, a difference of 0.16%), Assyrian/Chaldean/Syriac (11.9%, a difference of 0.18%), Immigrants from England (12.0%, a difference of 0.25%), and British West Indian (12.0%, a difference of 0.30%).
| Demographics | Rating | Rank | Disability |
| Ukrainians | 14.7 /100 | #198 | Poor 11.9% |
| Immigrants | Panama | 14.6 /100 | #199 | Poor 11.9% |
| Belizeans | 12.8 /100 | #200 | Poor 11.9% |
| Assyrians/Chaldeans/Syriacs | 12.6 /100 | #201 | Poor 11.9% |
| Immigrants | England | 12.0 /100 | #202 | Poor 12.0% |
| British West Indians | 11.5 /100 | #203 | Poor 12.0% |
| Mexican American Indians | 11.4 /100 | #204 | Poor 12.0% |
| Immigrants | Western Europe | 10.1 /100 | #205 | Poor 12.0% |
| Immigrants | Senegal | 9.4 /100 | #206 | Tragic 12.0% |
| Immigrants | Thailand | 9.3 /100 | #207 | Tragic 12.0% |
| Immigrants | Caribbean | 9.1 /100 | #208 | Tragic 12.0% |
| Danes | 8.7 /100 | #209 | Tragic 12.0% |
| Czechs | 7.9 /100 | #210 | Tragic 12.0% |
| Immigrants | Cambodia | 7.3 /100 | #211 | Tragic 12.0% |
| Austrians | 7.2 /100 | #212 | Tragic 12.0% |
| Immigrants | Iraq | 7.1 /100 | #213 | Tragic 12.0% |
| Immigrants | Somalia | 6.8 /100 | #214 | Tragic 12.0% |
| Immigrants | Canada | 6.1 /100 | #215 | Tragic 12.1% |
| Panamanians | 5.4 /100 | #216 | Tragic 12.1% |
| Immigrants | North America | 5.3 /100 | #217 | Tragic 12.1% |
| Immigrants | Jamaica | 5.0 /100 | #218 | Tragic 12.1% |