Immigrants from Jamaica vs Delaware Disability
COMPARE
Immigrants from Jamaica
Delaware
Disability
Disability Comparison
Immigrants from Jamaica
Delaware
12.1%
DISABILITY
5.0/ 100
METRIC RATING
218th/ 347
METRIC RANK
13.6%
DISABILITY
0.0/ 100
METRIC RATING
311th/ 347
METRIC RANK
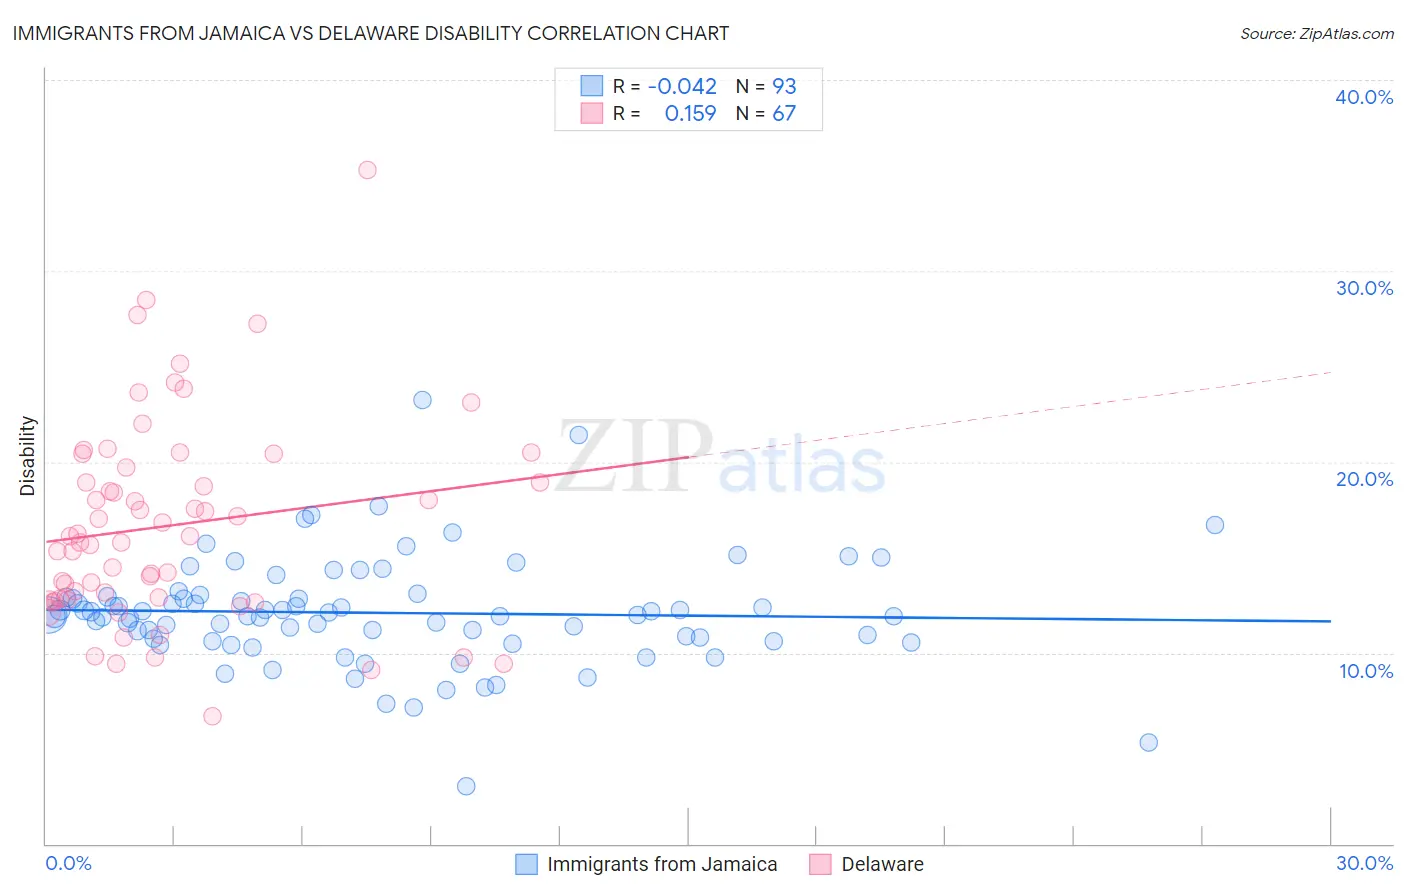
Immigrants from Jamaica vs Delaware Disability Correlation Chart
The statistical analysis conducted on geographies consisting of 301,749,565 people shows no correlation between the proportion of Immigrants from Jamaica and percentage of population with a disability in the United States with a correlation coefficient (R) of -0.042 and weighted average of 12.1%. Similarly, the statistical analysis conducted on geographies consisting of 96,240,981 people shows a poor positive correlation between the proportion of Delaware and percentage of population with a disability in the United States with a correlation coefficient (R) of 0.159 and weighted average of 13.6%, a difference of 12.7%.
Disability Correlation Summary
| Measurement | Immigrants from Jamaica | Delaware |
| Minimum | 3.0% | 6.7% |
| Maximum | 23.2% | 35.3% |
| Range | 20.2% | 28.6% |
| Mean | 12.1% | 16.7% |
| Median | 12.0% | 16.1% |
| Interquartile 25% (IQ1) | 10.7% | 12.8% |
| Interquartile 75% (IQ3) | 12.9% | 19.7% |
| Interquartile Range (IQR) | 2.3% | 6.9% |
| Standard Deviation (Sample) | 2.9% | 5.3% |
| Standard Deviation (Population) | 2.9% | 5.3% |
Similar Demographics by Disability
Demographics Similar to Immigrants from Jamaica by Disability
In terms of disability, the demographic groups most similar to Immigrants from Jamaica are Croatian (12.1%, a difference of 0.040%), Immigrants from North America (12.1%, a difference of 0.060%), Panamanian (12.1%, a difference of 0.070%), Immigrants from Bahamas (12.1%, a difference of 0.080%), and Northern European (12.1%, a difference of 0.20%).
| Demographics | Rating | Rank | Disability |
| Immigrants | Cambodia | 7.3 /100 | #211 | Tragic 12.0% |
| Austrians | 7.2 /100 | #212 | Tragic 12.0% |
| Immigrants | Iraq | 7.1 /100 | #213 | Tragic 12.0% |
| Immigrants | Somalia | 6.8 /100 | #214 | Tragic 12.0% |
| Immigrants | Canada | 6.1 /100 | #215 | Tragic 12.1% |
| Panamanians | 5.4 /100 | #216 | Tragic 12.1% |
| Immigrants | North America | 5.3 /100 | #217 | Tragic 12.1% |
| Immigrants | Jamaica | 5.0 /100 | #218 | Tragic 12.1% |
| Croatians | 4.9 /100 | #219 | Tragic 12.1% |
| Immigrants | Bahamas | 4.7 /100 | #220 | Tragic 12.1% |
| Northern Europeans | 4.2 /100 | #221 | Tragic 12.1% |
| Spanish American Indians | 4.1 /100 | #222 | Tragic 12.1% |
| Hispanics or Latinos | 3.9 /100 | #223 | Tragic 12.1% |
| Mexicans | 3.7 /100 | #224 | Tragic 12.1% |
| Senegalese | 3.5 /100 | #225 | Tragic 12.1% |
Demographics Similar to Delaware by Disability
In terms of disability, the demographic groups most similar to Delaware are Blackfeet (13.6%, a difference of 0.040%), Spanish American (13.6%, a difference of 0.24%), Tlingit-Haida (13.5%, a difference of 0.56%), Cree (13.7%, a difference of 0.59%), and Black/African American (13.7%, a difference of 0.63%).
| Demographics | Rating | Rank | Disability |
| Yakama | 0.0 /100 | #304 | Tragic 13.4% |
| French Canadians | 0.0 /100 | #305 | Tragic 13.4% |
| Cape Verdeans | 0.0 /100 | #306 | Tragic 13.5% |
| Shoshone | 0.0 /100 | #307 | Tragic 13.5% |
| French American Indians | 0.0 /100 | #308 | Tragic 13.5% |
| Tlingit-Haida | 0.0 /100 | #309 | Tragic 13.5% |
| Blackfeet | 0.0 /100 | #310 | Tragic 13.6% |
| Delaware | 0.0 /100 | #311 | Tragic 13.6% |
| Spanish Americans | 0.0 /100 | #312 | Tragic 13.6% |
| Cree | 0.0 /100 | #313 | Tragic 13.7% |
| Blacks/African Americans | 0.0 /100 | #314 | Tragic 13.7% |
| Puget Sound Salish | 0.0 /100 | #315 | Tragic 13.7% |
| Pima | 0.0 /100 | #316 | Tragic 13.7% |
| Immigrants | Cabo Verde | 0.0 /100 | #317 | Tragic 13.7% |
| Menominee | 0.0 /100 | #318 | Tragic 13.8% |