Immigrants from Jamaica vs Immigrants from Caribbean Disability
COMPARE
Immigrants from Jamaica
Immigrants from Caribbean
Disability
Disability Comparison
Immigrants from Jamaica
Immigrants from Caribbean
12.1%
DISABILITY
5.0/ 100
METRIC RATING
218th/ 347
METRIC RANK
12.0%
DISABILITY
9.1/ 100
METRIC RATING
208th/ 347
METRIC RANK
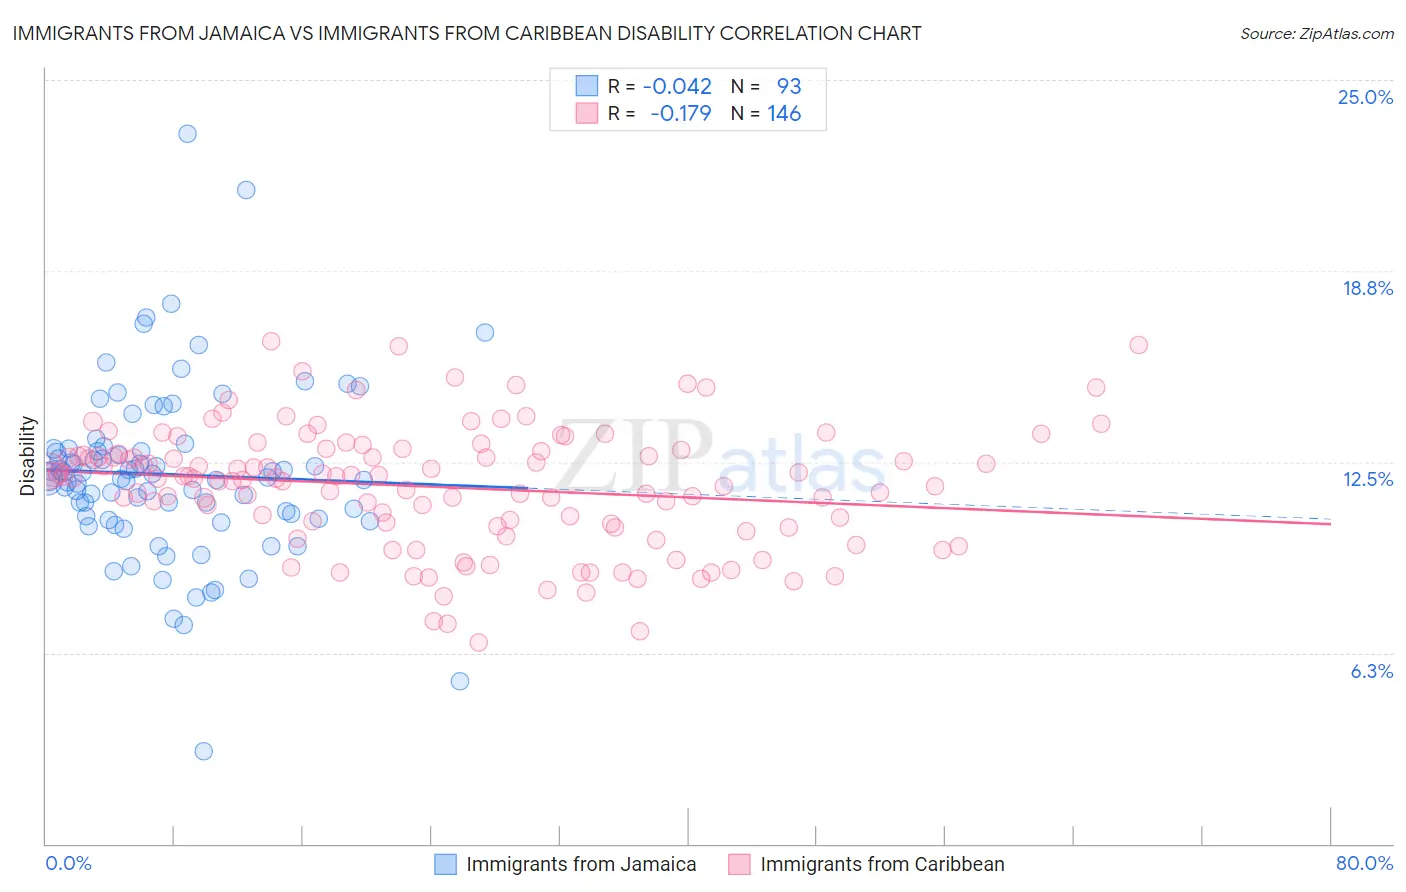
Immigrants from Jamaica vs Immigrants from Caribbean Disability Correlation Chart
The statistical analysis conducted on geographies consisting of 301,749,565 people shows no correlation between the proportion of Immigrants from Jamaica and percentage of population with a disability in the United States with a correlation coefficient (R) of -0.042 and weighted average of 12.1%. Similarly, the statistical analysis conducted on geographies consisting of 449,955,914 people shows a poor negative correlation between the proportion of Immigrants from Caribbean and percentage of population with a disability in the United States with a correlation coefficient (R) of -0.179 and weighted average of 12.0%, a difference of 0.68%.
Disability Correlation Summary
| Measurement | Immigrants from Jamaica | Immigrants from Caribbean |
| Minimum | 3.0% | 6.6% |
| Maximum | 23.2% | 16.5% |
| Range | 20.2% | 9.9% |
| Mean | 12.1% | 11.7% |
| Median | 12.0% | 12.0% |
| Interquartile 25% (IQ1) | 10.7% | 10.4% |
| Interquartile 75% (IQ3) | 12.9% | 12.8% |
| Interquartile Range (IQR) | 2.3% | 2.5% |
| Standard Deviation (Sample) | 2.9% | 2.0% |
| Standard Deviation (Population) | 2.9% | 2.0% |
Demographics Similar to Immigrants from Jamaica and Immigrants from Caribbean by Disability
In terms of disability, the demographic groups most similar to Immigrants from Jamaica are Croatian (12.1%, a difference of 0.040%), Immigrants from North America (12.1%, a difference of 0.060%), Panamanian (12.1%, a difference of 0.070%), Immigrants from Bahamas (12.1%, a difference of 0.080%), and Northern European (12.1%, a difference of 0.20%). Similarly, the demographic groups most similar to Immigrants from Caribbean are Immigrants from Thailand (12.0%, a difference of 0.020%), Immigrants from Senegal (12.0%, a difference of 0.040%), Danish (12.0%, a difference of 0.050%), Immigrants from Western Europe (12.0%, a difference of 0.12%), and Czech (12.0%, a difference of 0.17%).
| Demographics | Rating | Rank | Disability |
| British West Indians | 11.5 /100 | #203 | Poor 12.0% |
| Mexican American Indians | 11.4 /100 | #204 | Poor 12.0% |
| Immigrants | Western Europe | 10.1 /100 | #205 | Poor 12.0% |
| Immigrants | Senegal | 9.4 /100 | #206 | Tragic 12.0% |
| Immigrants | Thailand | 9.3 /100 | #207 | Tragic 12.0% |
| Immigrants | Caribbean | 9.1 /100 | #208 | Tragic 12.0% |
| Danes | 8.7 /100 | #209 | Tragic 12.0% |
| Czechs | 7.9 /100 | #210 | Tragic 12.0% |
| Immigrants | Cambodia | 7.3 /100 | #211 | Tragic 12.0% |
| Austrians | 7.2 /100 | #212 | Tragic 12.0% |
| Immigrants | Iraq | 7.1 /100 | #213 | Tragic 12.0% |
| Immigrants | Somalia | 6.8 /100 | #214 | Tragic 12.0% |
| Immigrants | Canada | 6.1 /100 | #215 | Tragic 12.1% |
| Panamanians | 5.4 /100 | #216 | Tragic 12.1% |
| Immigrants | North America | 5.3 /100 | #217 | Tragic 12.1% |
| Immigrants | Jamaica | 5.0 /100 | #218 | Tragic 12.1% |
| Croatians | 4.9 /100 | #219 | Tragic 12.1% |
| Immigrants | Bahamas | 4.7 /100 | #220 | Tragic 12.1% |
| Northern Europeans | 4.2 /100 | #221 | Tragic 12.1% |
| Spanish American Indians | 4.1 /100 | #222 | Tragic 12.1% |
| Hispanics or Latinos | 3.9 /100 | #223 | Tragic 12.1% |