Immigrants from Jamaica vs Immigrants from Netherlands Disability
COMPARE
Immigrants from Jamaica
Immigrants from Netherlands
Disability
Disability Comparison
Immigrants from Jamaica
Immigrants from Netherlands
12.1%
DISABILITY
5.0/ 100
METRIC RATING
218th/ 347
METRIC RANK
11.6%
DISABILITY
69.8/ 100
METRIC RATING
155th/ 347
METRIC RANK
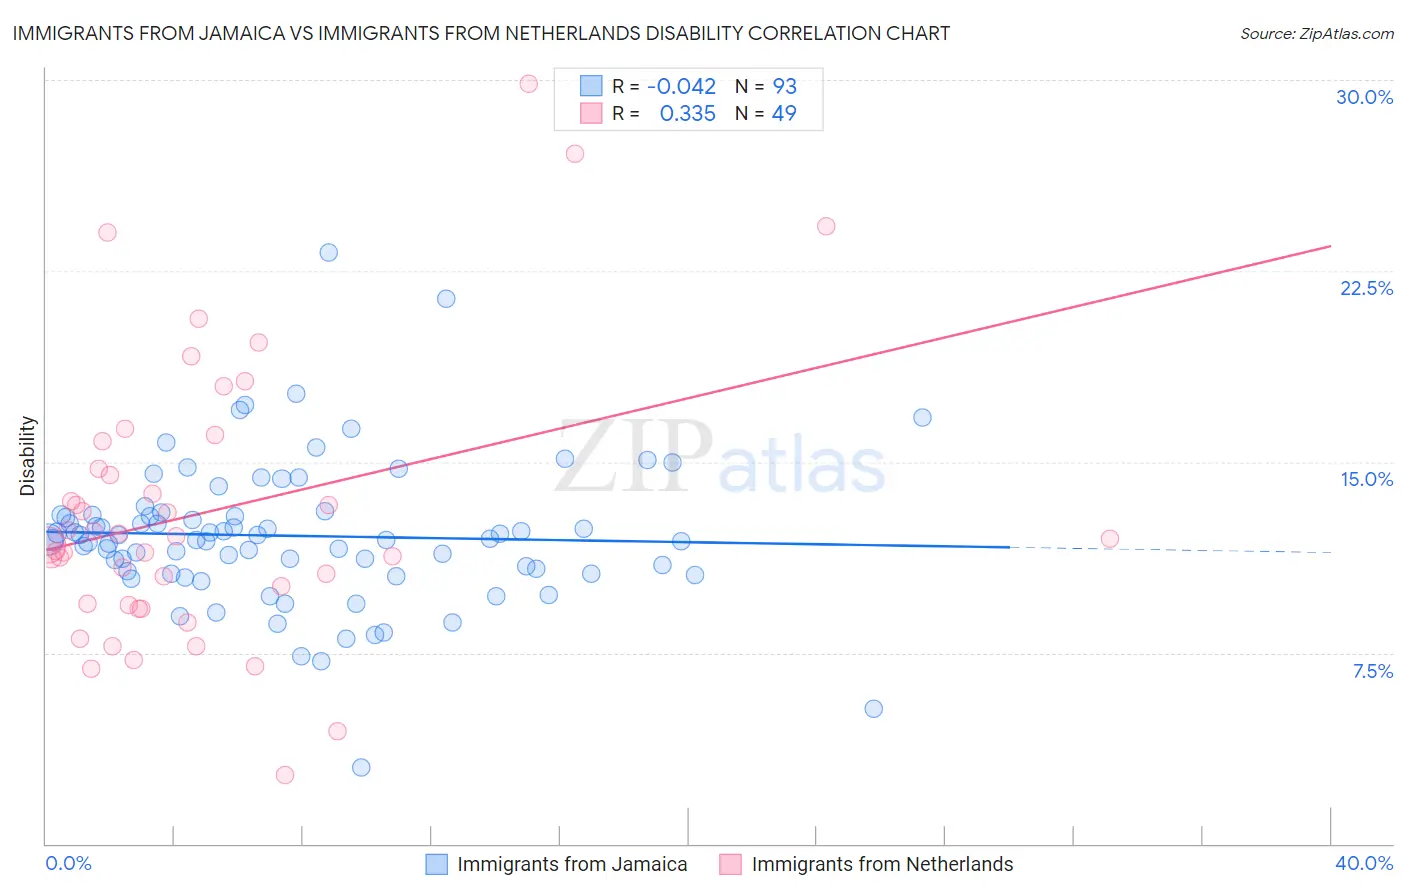
Immigrants from Jamaica vs Immigrants from Netherlands Disability Correlation Chart
The statistical analysis conducted on geographies consisting of 301,749,565 people shows no correlation between the proportion of Immigrants from Jamaica and percentage of population with a disability in the United States with a correlation coefficient (R) of -0.042 and weighted average of 12.1%. Similarly, the statistical analysis conducted on geographies consisting of 237,881,665 people shows a mild positive correlation between the proportion of Immigrants from Netherlands and percentage of population with a disability in the United States with a correlation coefficient (R) of 0.335 and weighted average of 11.6%, a difference of 4.2%.
Disability Correlation Summary
| Measurement | Immigrants from Jamaica | Immigrants from Netherlands |
| Minimum | 3.0% | 2.7% |
| Maximum | 23.2% | 29.8% |
| Range | 20.2% | 27.1% |
| Mean | 12.1% | 13.0% |
| Median | 12.0% | 12.0% |
| Interquartile 25% (IQ1) | 10.7% | 9.4% |
| Interquartile 75% (IQ3) | 12.9% | 15.3% |
| Interquartile Range (IQR) | 2.3% | 5.9% |
| Standard Deviation (Sample) | 2.9% | 5.5% |
| Standard Deviation (Population) | 2.9% | 5.4% |
Similar Demographics by Disability
Demographics Similar to Immigrants from Jamaica by Disability
In terms of disability, the demographic groups most similar to Immigrants from Jamaica are Croatian (12.1%, a difference of 0.040%), Immigrants from North America (12.1%, a difference of 0.060%), Panamanian (12.1%, a difference of 0.070%), Immigrants from Bahamas (12.1%, a difference of 0.080%), and Northern European (12.1%, a difference of 0.20%).
| Demographics | Rating | Rank | Disability |
| Immigrants | Cambodia | 7.3 /100 | #211 | Tragic 12.0% |
| Austrians | 7.2 /100 | #212 | Tragic 12.0% |
| Immigrants | Iraq | 7.1 /100 | #213 | Tragic 12.0% |
| Immigrants | Somalia | 6.8 /100 | #214 | Tragic 12.0% |
| Immigrants | Canada | 6.1 /100 | #215 | Tragic 12.1% |
| Panamanians | 5.4 /100 | #216 | Tragic 12.1% |
| Immigrants | North America | 5.3 /100 | #217 | Tragic 12.1% |
| Immigrants | Jamaica | 5.0 /100 | #218 | Tragic 12.1% |
| Croatians | 4.9 /100 | #219 | Tragic 12.1% |
| Immigrants | Bahamas | 4.7 /100 | #220 | Tragic 12.1% |
| Northern Europeans | 4.2 /100 | #221 | Tragic 12.1% |
| Spanish American Indians | 4.1 /100 | #222 | Tragic 12.1% |
| Hispanics or Latinos | 3.9 /100 | #223 | Tragic 12.1% |
| Mexicans | 3.7 /100 | #224 | Tragic 12.1% |
| Senegalese | 3.5 /100 | #225 | Tragic 12.1% |
Demographics Similar to Immigrants from Netherlands by Disability
In terms of disability, the demographic groups most similar to Immigrants from Netherlands are Immigrants from Fiji (11.6%, a difference of 0.010%), Immigrants from Middle Africa (11.6%, a difference of 0.020%), Immigrants from Guatemala (11.6%, a difference of 0.070%), Immigrants from Ghana (11.6%, a difference of 0.080%), and Immigrants from Moldova (11.6%, a difference of 0.12%).
| Demographics | Rating | Rank | Disability |
| Sudanese | 77.1 /100 | #148 | Good 11.5% |
| Immigrants | Norway | 73.2 /100 | #149 | Good 11.6% |
| Romanians | 72.7 /100 | #150 | Good 11.6% |
| Immigrants | Kenya | 72.1 /100 | #151 | Good 11.6% |
| Immigrants | Moldova | 72.0 /100 | #152 | Good 11.6% |
| Immigrants | Ghana | 71.2 /100 | #153 | Good 11.6% |
| Immigrants | Guatemala | 71.1 /100 | #154 | Good 11.6% |
| Immigrants | Netherlands | 69.8 /100 | #155 | Good 11.6% |
| Immigrants | Fiji | 69.5 /100 | #156 | Good 11.6% |
| Immigrants | Middle Africa | 69.5 /100 | #157 | Good 11.6% |
| Armenians | 65.9 /100 | #158 | Good 11.6% |
| Guatemalans | 65.1 /100 | #159 | Good 11.6% |
| Immigrants | Barbados | 64.2 /100 | #160 | Good 11.6% |
| Immigrants | Cuba | 62.8 /100 | #161 | Good 11.6% |
| Immigrants | Haiti | 59.2 /100 | #162 | Average 11.7% |