Immigrants from Jamaica vs Hawaiian Per Capita Income
COMPARE
Immigrants from Jamaica
Hawaiian
Per Capita Income
Per Capita Income Comparison
Immigrants from Jamaica
Hawaiians
$38,766
PER CAPITA INCOME
0.4/ 100
METRIC RATING
269th/ 347
METRIC RANK
$39,403
PER CAPITA INCOME
0.8/ 100
METRIC RATING
256th/ 347
METRIC RANK
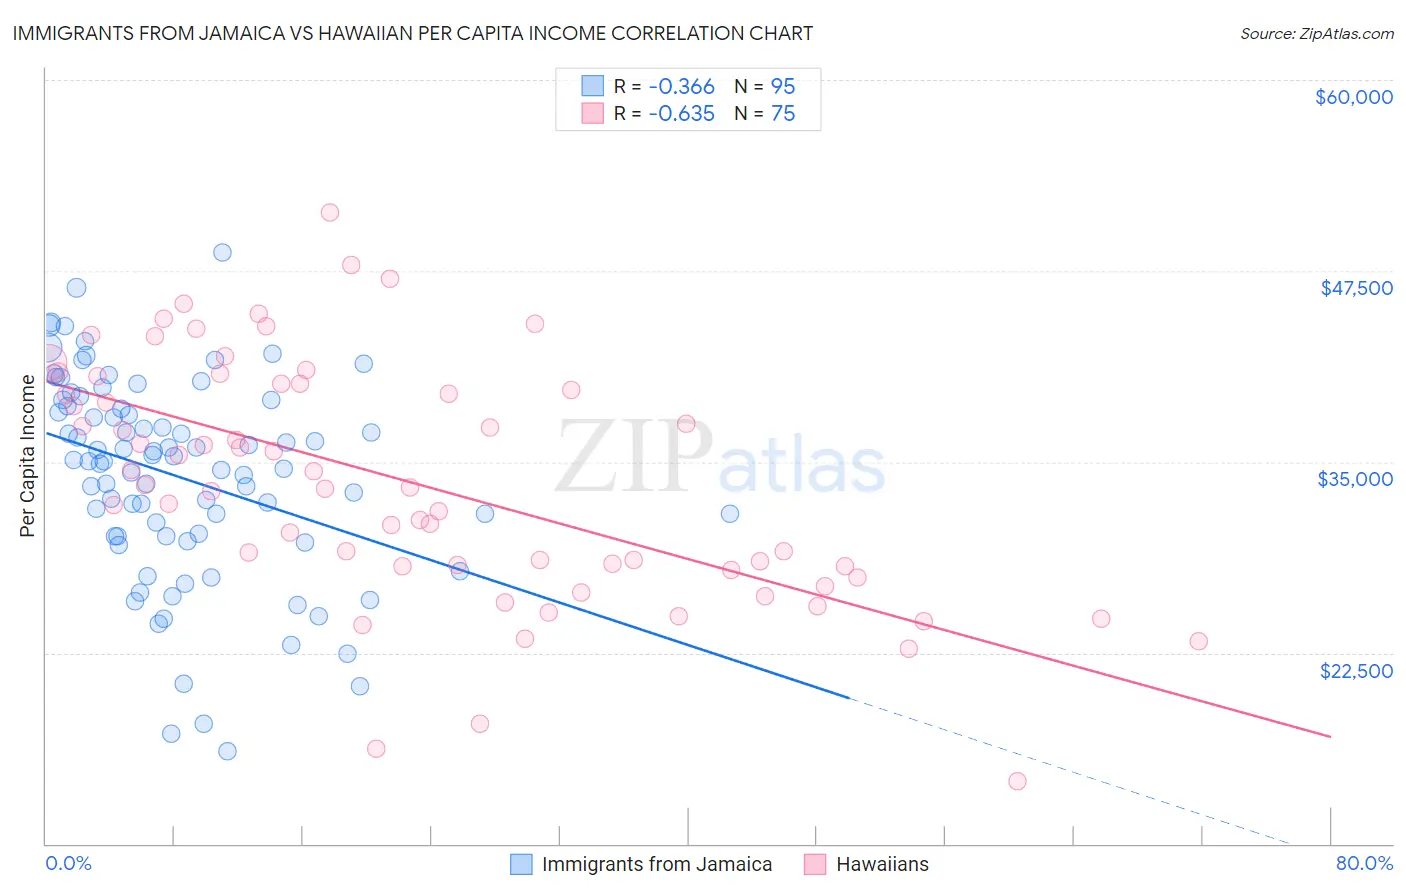
Immigrants from Jamaica vs Hawaiian Per Capita Income Correlation Chart
The statistical analysis conducted on geographies consisting of 301,814,943 people shows a mild negative correlation between the proportion of Immigrants from Jamaica and per capita income in the United States with a correlation coefficient (R) of -0.366 and weighted average of $38,766. Similarly, the statistical analysis conducted on geographies consisting of 327,629,067 people shows a significant negative correlation between the proportion of Hawaiians and per capita income in the United States with a correlation coefficient (R) of -0.635 and weighted average of $39,403, a difference of 1.6%.
Per Capita Income Correlation Summary
| Measurement | Immigrants from Jamaica | Hawaiian |
| Minimum | $16,033 | $14,082 |
| Maximum | $48,680 | $51,335 |
| Range | $32,647 | $37,253 |
| Mean | $34,027 | $33,620 |
| Median | $35,066 | $33,340 |
| Interquartile 25% (IQ1) | $30,104 | $28,161 |
| Interquartile 75% (IQ3) | $38,633 | $40,110 |
| Interquartile Range (IQR) | $8,529 | $11,949 |
| Standard Deviation (Sample) | $6,626 | $7,838 |
| Standard Deviation (Population) | $6,591 | $7,785 |
Demographics Similar to Immigrants from Jamaica and Hawaiians by Per Capita Income
In terms of per capita income, the demographic groups most similar to Immigrants from Jamaica are Liberian ($38,780, a difference of 0.040%), Immigrants from Zaire ($38,848, a difference of 0.21%), Salvadoran ($38,858, a difference of 0.24%), Immigrants from Belize ($38,614, a difference of 0.39%), and Central American ($38,560, a difference of 0.53%). Similarly, the demographic groups most similar to Hawaiians are Nicaraguan ($39,372, a difference of 0.080%), Immigrants from Middle Africa ($39,529, a difference of 0.32%), Alaska Native ($39,558, a difference of 0.39%), Osage ($39,568, a difference of 0.42%), and Jamaican ($39,231, a difference of 0.44%).
| Demographics | Rating | Rank | Per Capita Income |
| Immigrants | Azores | 1.0 /100 | #252 | Tragic $39,608 |
| Osage | 1.0 /100 | #253 | Tragic $39,568 |
| Alaska Natives | 1.0 /100 | #254 | Tragic $39,558 |
| Immigrants | Middle Africa | 1.0 /100 | #255 | Tragic $39,529 |
| Hawaiians | 0.8 /100 | #256 | Tragic $39,403 |
| Nicaraguans | 0.8 /100 | #257 | Tragic $39,372 |
| Jamaicans | 0.7 /100 | #258 | Tragic $39,231 |
| Malaysians | 0.7 /100 | #259 | Tragic $39,194 |
| Alaskan Athabascans | 0.6 /100 | #260 | Tragic $39,163 |
| Marshallese | 0.6 /100 | #261 | Tragic $39,108 |
| Iroquois | 0.6 /100 | #262 | Tragic $39,104 |
| Belizeans | 0.6 /100 | #263 | Tragic $39,097 |
| Americans | 0.6 /100 | #264 | Tragic $39,039 |
| Spanish Americans | 0.5 /100 | #265 | Tragic $39,012 |
| Salvadorans | 0.5 /100 | #266 | Tragic $38,858 |
| Immigrants | Zaire | 0.4 /100 | #267 | Tragic $38,848 |
| Liberians | 0.4 /100 | #268 | Tragic $38,780 |
| Immigrants | Jamaica | 0.4 /100 | #269 | Tragic $38,766 |
| Immigrants | Belize | 0.3 /100 | #270 | Tragic $38,614 |
| Central Americans | 0.3 /100 | #271 | Tragic $38,560 |
| Immigrants | Cabo Verde | 0.3 /100 | #272 | Tragic $38,540 |