Immigrants from Jamaica vs French Canadian Disability
COMPARE
Immigrants from Jamaica
French Canadian
Disability
Disability Comparison
Immigrants from Jamaica
French Canadians
12.1%
DISABILITY
5.0/ 100
METRIC RATING
218th/ 347
METRIC RANK
13.4%
DISABILITY
0.0/ 100
METRIC RATING
305th/ 347
METRIC RANK
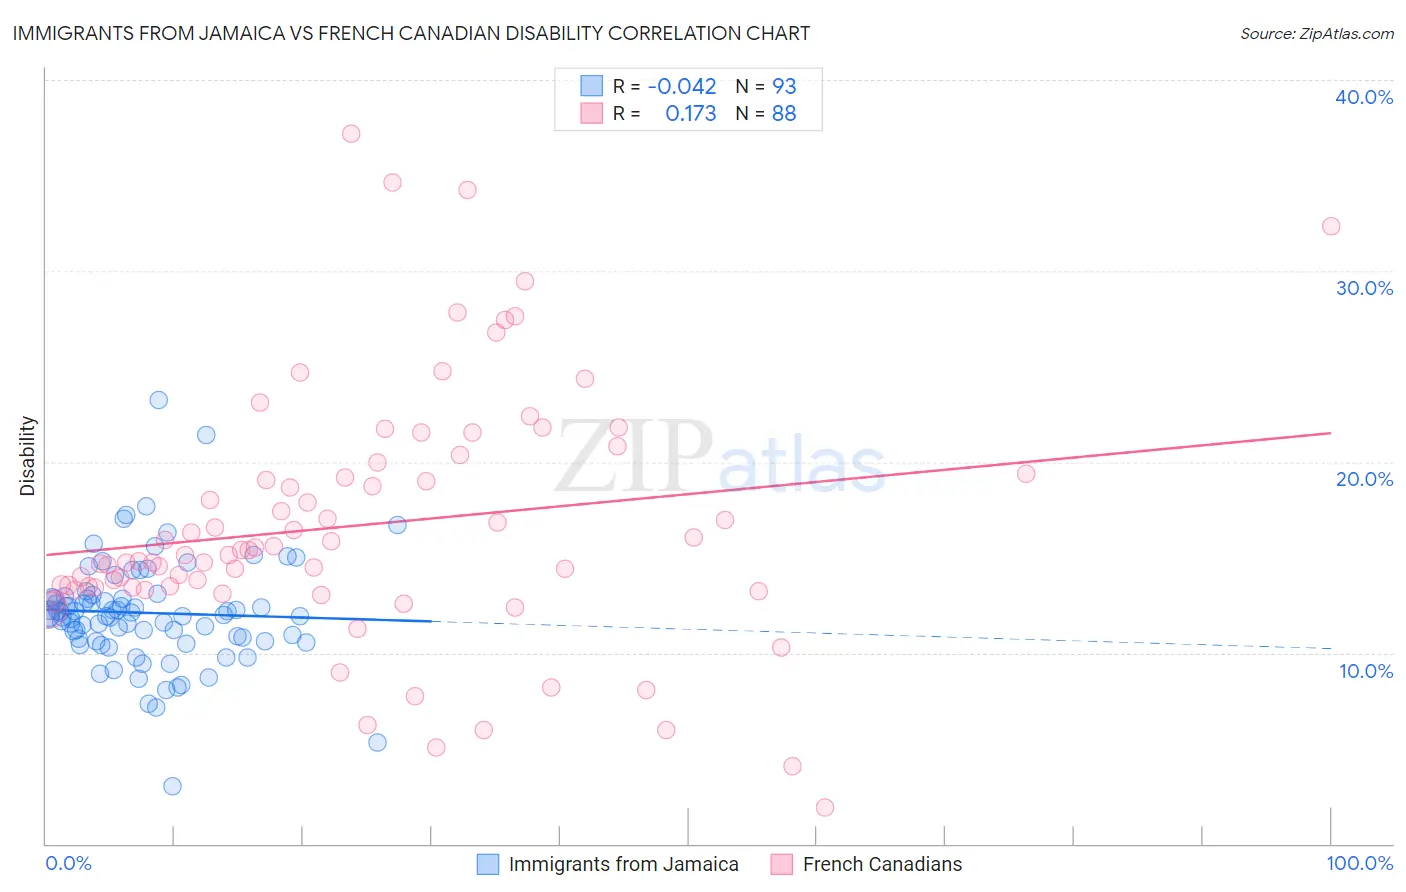
Immigrants from Jamaica vs French Canadian Disability Correlation Chart
The statistical analysis conducted on geographies consisting of 301,749,565 people shows no correlation between the proportion of Immigrants from Jamaica and percentage of population with a disability in the United States with a correlation coefficient (R) of -0.042 and weighted average of 12.1%. Similarly, the statistical analysis conducted on geographies consisting of 502,588,623 people shows a poor positive correlation between the proportion of French Canadians and percentage of population with a disability in the United States with a correlation coefficient (R) of 0.173 and weighted average of 13.4%, a difference of 11.1%.
Disability Correlation Summary
| Measurement | Immigrants from Jamaica | French Canadian |
| Minimum | 3.0% | 1.9% |
| Maximum | 23.2% | 37.2% |
| Range | 20.2% | 35.3% |
| Mean | 12.1% | 16.7% |
| Median | 12.0% | 15.3% |
| Interquartile 25% (IQ1) | 10.7% | 13.4% |
| Interquartile 75% (IQ3) | 12.9% | 19.7% |
| Interquartile Range (IQR) | 2.3% | 6.3% |
| Standard Deviation (Sample) | 2.9% | 6.7% |
| Standard Deviation (Population) | 2.9% | 6.6% |
Similar Demographics by Disability
Demographics Similar to Immigrants from Jamaica by Disability
In terms of disability, the demographic groups most similar to Immigrants from Jamaica are Croatian (12.1%, a difference of 0.040%), Immigrants from North America (12.1%, a difference of 0.060%), Panamanian (12.1%, a difference of 0.070%), Immigrants from Bahamas (12.1%, a difference of 0.080%), and Northern European (12.1%, a difference of 0.20%).
| Demographics | Rating | Rank | Disability |
| Immigrants | Cambodia | 7.3 /100 | #211 | Tragic 12.0% |
| Austrians | 7.2 /100 | #212 | Tragic 12.0% |
| Immigrants | Iraq | 7.1 /100 | #213 | Tragic 12.0% |
| Immigrants | Somalia | 6.8 /100 | #214 | Tragic 12.0% |
| Immigrants | Canada | 6.1 /100 | #215 | Tragic 12.1% |
| Panamanians | 5.4 /100 | #216 | Tragic 12.1% |
| Immigrants | North America | 5.3 /100 | #217 | Tragic 12.1% |
| Immigrants | Jamaica | 5.0 /100 | #218 | Tragic 12.1% |
| Croatians | 4.9 /100 | #219 | Tragic 12.1% |
| Immigrants | Bahamas | 4.7 /100 | #220 | Tragic 12.1% |
| Northern Europeans | 4.2 /100 | #221 | Tragic 12.1% |
| Spanish American Indians | 4.1 /100 | #222 | Tragic 12.1% |
| Hispanics or Latinos | 3.9 /100 | #223 | Tragic 12.1% |
| Mexicans | 3.7 /100 | #224 | Tragic 12.1% |
| Senegalese | 3.5 /100 | #225 | Tragic 12.1% |
Demographics Similar to French Canadians by Disability
In terms of disability, the demographic groups most similar to French Canadians are Yakama (13.4%, a difference of 0.35%), Cape Verdean (13.5%, a difference of 0.61%), Shoshone (13.5%, a difference of 0.66%), French American Indian (13.5%, a difference of 0.75%), and Scotch-Irish (13.3%, a difference of 0.81%).
| Demographics | Rating | Rank | Disability |
| Alaska Natives | 0.0 /100 | #298 | Tragic 13.2% |
| French | 0.0 /100 | #299 | Tragic 13.2% |
| Pennsylvania Germans | 0.0 /100 | #300 | Tragic 13.2% |
| Immigrants | Micronesia | 0.0 /100 | #301 | Tragic 13.2% |
| Arapaho | 0.0 /100 | #302 | Tragic 13.2% |
| Scotch-Irish | 0.0 /100 | #303 | Tragic 13.3% |
| Yakama | 0.0 /100 | #304 | Tragic 13.4% |
| French Canadians | 0.0 /100 | #305 | Tragic 13.4% |
| Cape Verdeans | 0.0 /100 | #306 | Tragic 13.5% |
| Shoshone | 0.0 /100 | #307 | Tragic 13.5% |
| French American Indians | 0.0 /100 | #308 | Tragic 13.5% |
| Tlingit-Haida | 0.0 /100 | #309 | Tragic 13.5% |
| Blackfeet | 0.0 /100 | #310 | Tragic 13.6% |
| Delaware | 0.0 /100 | #311 | Tragic 13.6% |
| Spanish Americans | 0.0 /100 | #312 | Tragic 13.6% |