Tongan vs Hawaiian Disability
COMPARE
Tongan
Hawaiian
Disability
Disability Comparison
Tongans
Hawaiians
10.8%
DISABILITY
99.9/ 100
METRIC RATING
46th/ 347
METRIC RANK
12.5%
DISABILITY
0.2/ 100
METRIC RATING
263rd/ 347
METRIC RANK
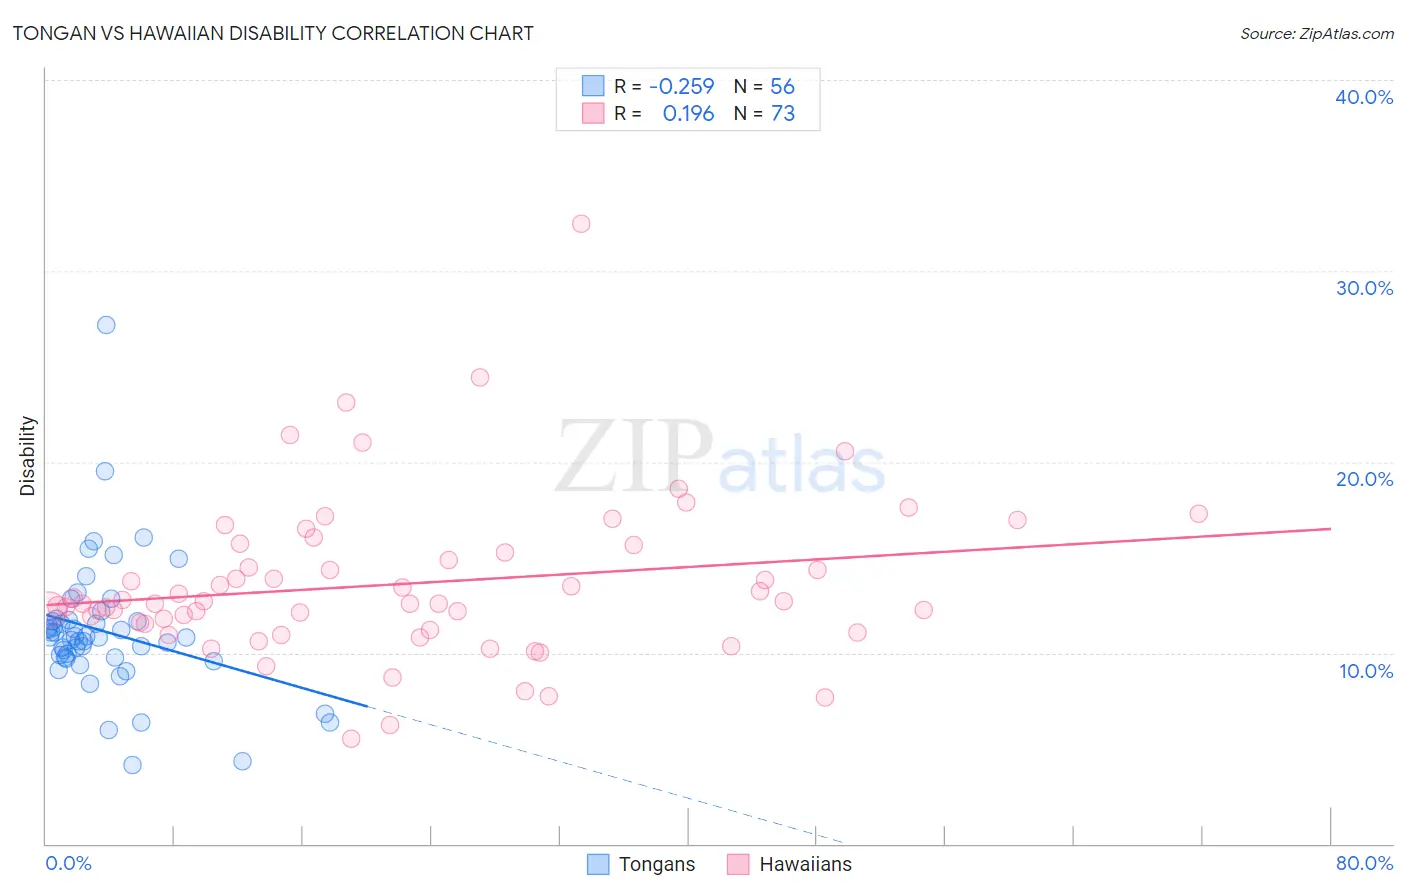
Tongan vs Hawaiian Disability Correlation Chart
The statistical analysis conducted on geographies consisting of 102,894,634 people shows a weak negative correlation between the proportion of Tongans and percentage of population with a disability in the United States with a correlation coefficient (R) of -0.259 and weighted average of 10.8%. Similarly, the statistical analysis conducted on geographies consisting of 327,510,091 people shows a poor positive correlation between the proportion of Hawaiians and percentage of population with a disability in the United States with a correlation coefficient (R) of 0.196 and weighted average of 12.5%, a difference of 15.2%.
Disability Correlation Summary
| Measurement | Tongan | Hawaiian |
| Minimum | 4.2% | 5.5% |
| Maximum | 27.1% | 32.5% |
| Range | 23.0% | 27.0% |
| Mean | 11.1% | 13.6% |
| Median | 10.8% | 12.6% |
| Interquartile 25% (IQ1) | 9.8% | 11.4% |
| Interquartile 75% (IQ3) | 11.7% | 15.5% |
| Interquartile Range (IQR) | 1.9% | 4.1% |
| Standard Deviation (Sample) | 3.5% | 4.2% |
| Standard Deviation (Population) | 3.5% | 4.2% |
Similar Demographics by Disability
Demographics Similar to Tongans by Disability
In terms of disability, the demographic groups most similar to Tongans are Immigrants from Peru (10.8%, a difference of 0.010%), Taiwanese (10.8%, a difference of 0.010%), Soviet Union (10.9%, a difference of 0.20%), Vietnamese (10.9%, a difference of 0.26%), and Immigrants from Saudi Arabia (10.9%, a difference of 0.26%).
| Demographics | Rating | Rank | Disability |
| Cambodians | 99.9 /100 | #39 | Exceptional 10.8% |
| Mongolians | 99.9 /100 | #40 | Exceptional 10.8% |
| Immigrants | Australia | 99.9 /100 | #41 | Exceptional 10.8% |
| Immigrants | Nepal | 99.9 /100 | #42 | Exceptional 10.8% |
| Israelis | 99.9 /100 | #43 | Exceptional 10.8% |
| Immigrants | Japan | 99.9 /100 | #44 | Exceptional 10.8% |
| Immigrants | Peru | 99.9 /100 | #45 | Exceptional 10.8% |
| Tongans | 99.9 /100 | #46 | Exceptional 10.8% |
| Taiwanese | 99.9 /100 | #47 | Exceptional 10.8% |
| Soviet Union | 99.9 /100 | #48 | Exceptional 10.9% |
| Vietnamese | 99.9 /100 | #49 | Exceptional 10.9% |
| Immigrants | Saudi Arabia | 99.9 /100 | #50 | Exceptional 10.9% |
| Peruvians | 99.8 /100 | #51 | Exceptional 10.9% |
| South Americans | 99.8 /100 | #52 | Exceptional 10.9% |
| Immigrants | Spain | 99.8 /100 | #53 | Exceptional 10.9% |
Demographics Similar to Hawaiians by Disability
In terms of disability, the demographic groups most similar to Hawaiians are Immigrants from Germany (12.5%, a difference of 0.11%), U.S. Virgin Islander (12.5%, a difference of 0.13%), Native Hawaiian (12.5%, a difference of 0.20%), Czechoslovakian (12.5%, a difference of 0.29%), and Spaniard (12.5%, a difference of 0.37%).
| Demographics | Rating | Rank | Disability |
| Immigrants | Dominica | 0.6 /100 | #256 | Tragic 12.4% |
| Immigrants | Laos | 0.5 /100 | #257 | Tragic 12.4% |
| Slavs | 0.5 /100 | #258 | Tragic 12.4% |
| Canadians | 0.4 /100 | #259 | Tragic 12.4% |
| Immigrants | Liberia | 0.4 /100 | #260 | Tragic 12.4% |
| Scandinavians | 0.4 /100 | #261 | Tragic 12.4% |
| Native Hawaiians | 0.3 /100 | #262 | Tragic 12.5% |
| Hawaiians | 0.2 /100 | #263 | Tragic 12.5% |
| Immigrants | Germany | 0.2 /100 | #264 | Tragic 12.5% |
| U.S. Virgin Islanders | 0.2 /100 | #265 | Tragic 12.5% |
| Czechoslovakians | 0.2 /100 | #266 | Tragic 12.5% |
| Spaniards | 0.2 /100 | #267 | Tragic 12.5% |
| Bangladeshis | 0.1 /100 | #268 | Tragic 12.6% |
| Immigrants | Dominican Republic | 0.1 /100 | #269 | Tragic 12.6% |
| Portuguese | 0.1 /100 | #270 | Tragic 12.6% |