Immigrants from Bahamas vs Hawaiian Disability
COMPARE
Immigrants from Bahamas
Hawaiian
Disability
Disability Comparison
Immigrants from Bahamas
Hawaiians
12.1%
DISABILITY
4.7/ 100
METRIC RATING
220th/ 347
METRIC RANK
12.5%
DISABILITY
0.2/ 100
METRIC RATING
263rd/ 347
METRIC RANK
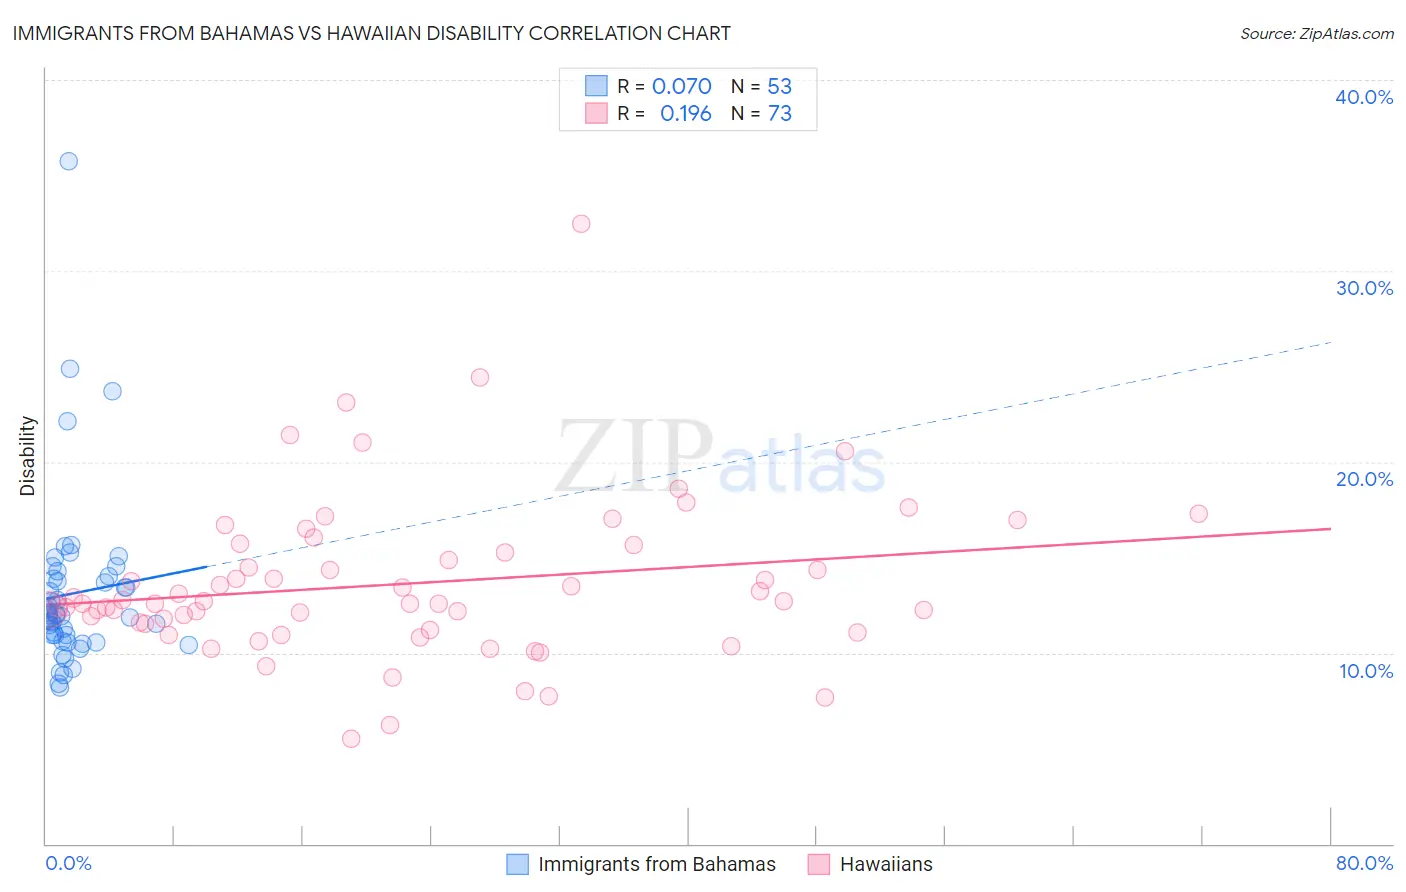
Immigrants from Bahamas vs Hawaiian Disability Correlation Chart
The statistical analysis conducted on geographies consisting of 104,655,290 people shows a slight positive correlation between the proportion of Immigrants from Bahamas and percentage of population with a disability in the United States with a correlation coefficient (R) of 0.070 and weighted average of 12.1%. Similarly, the statistical analysis conducted on geographies consisting of 327,510,091 people shows a poor positive correlation between the proportion of Hawaiians and percentage of population with a disability in the United States with a correlation coefficient (R) of 0.196 and weighted average of 12.5%, a difference of 3.2%.
Disability Correlation Summary
| Measurement | Immigrants from Bahamas | Hawaiian |
| Minimum | 8.2% | 5.5% |
| Maximum | 35.8% | 32.5% |
| Range | 27.6% | 27.0% |
| Mean | 13.1% | 13.6% |
| Median | 12.0% | 12.6% |
| Interquartile 25% (IQ1) | 10.8% | 11.4% |
| Interquartile 75% (IQ3) | 14.0% | 15.5% |
| Interquartile Range (IQR) | 3.2% | 4.1% |
| Standard Deviation (Sample) | 4.6% | 4.2% |
| Standard Deviation (Population) | 4.5% | 4.2% |
Similar Demographics by Disability
Demographics Similar to Immigrants from Bahamas by Disability
In terms of disability, the demographic groups most similar to Immigrants from Bahamas are Croatian (12.1%, a difference of 0.040%), Immigrants from Jamaica (12.1%, a difference of 0.080%), Northern European (12.1%, a difference of 0.12%), Immigrants from North America (12.1%, a difference of 0.15%), and Panamanian (12.1%, a difference of 0.16%).
| Demographics | Rating | Rank | Disability |
| Immigrants | Iraq | 7.1 /100 | #213 | Tragic 12.0% |
| Immigrants | Somalia | 6.8 /100 | #214 | Tragic 12.0% |
| Immigrants | Canada | 6.1 /100 | #215 | Tragic 12.1% |
| Panamanians | 5.4 /100 | #216 | Tragic 12.1% |
| Immigrants | North America | 5.3 /100 | #217 | Tragic 12.1% |
| Immigrants | Jamaica | 5.0 /100 | #218 | Tragic 12.1% |
| Croatians | 4.9 /100 | #219 | Tragic 12.1% |
| Immigrants | Bahamas | 4.7 /100 | #220 | Tragic 12.1% |
| Northern Europeans | 4.2 /100 | #221 | Tragic 12.1% |
| Spanish American Indians | 4.1 /100 | #222 | Tragic 12.1% |
| Hispanics or Latinos | 3.9 /100 | #223 | Tragic 12.1% |
| Mexicans | 3.7 /100 | #224 | Tragic 12.1% |
| Senegalese | 3.5 /100 | #225 | Tragic 12.1% |
| Jamaicans | 3.3 /100 | #226 | Tragic 12.1% |
| Alsatians | 3.3 /100 | #227 | Tragic 12.1% |
Demographics Similar to Hawaiians by Disability
In terms of disability, the demographic groups most similar to Hawaiians are Immigrants from Germany (12.5%, a difference of 0.11%), U.S. Virgin Islander (12.5%, a difference of 0.13%), Native Hawaiian (12.5%, a difference of 0.20%), Czechoslovakian (12.5%, a difference of 0.29%), and Spaniard (12.5%, a difference of 0.37%).
| Demographics | Rating | Rank | Disability |
| Immigrants | Dominica | 0.6 /100 | #256 | Tragic 12.4% |
| Immigrants | Laos | 0.5 /100 | #257 | Tragic 12.4% |
| Slavs | 0.5 /100 | #258 | Tragic 12.4% |
| Canadians | 0.4 /100 | #259 | Tragic 12.4% |
| Immigrants | Liberia | 0.4 /100 | #260 | Tragic 12.4% |
| Scandinavians | 0.4 /100 | #261 | Tragic 12.4% |
| Native Hawaiians | 0.3 /100 | #262 | Tragic 12.5% |
| Hawaiians | 0.2 /100 | #263 | Tragic 12.5% |
| Immigrants | Germany | 0.2 /100 | #264 | Tragic 12.5% |
| U.S. Virgin Islanders | 0.2 /100 | #265 | Tragic 12.5% |
| Czechoslovakians | 0.2 /100 | #266 | Tragic 12.5% |
| Spaniards | 0.2 /100 | #267 | Tragic 12.5% |
| Bangladeshis | 0.1 /100 | #268 | Tragic 12.6% |
| Immigrants | Dominican Republic | 0.1 /100 | #269 | Tragic 12.6% |
| Portuguese | 0.1 /100 | #270 | Tragic 12.6% |