Immigrants from Czechoslovakia vs Hungarian Disability Age 5 to 17
COMPARE
Immigrants from Czechoslovakia
Hungarian
Disability Age 5 to 17
Disability Age 5 to 17 Comparison
Immigrants from Czechoslovakia
Hungarians
5.2%
DISABILITY AGE 5 TO 17
99.7/ 100
METRIC RATING
73rd/ 347
METRIC RANK
5.8%
DISABILITY AGE 5 TO 17
2.6/ 100
METRIC RATING
238th/ 347
METRIC RANK
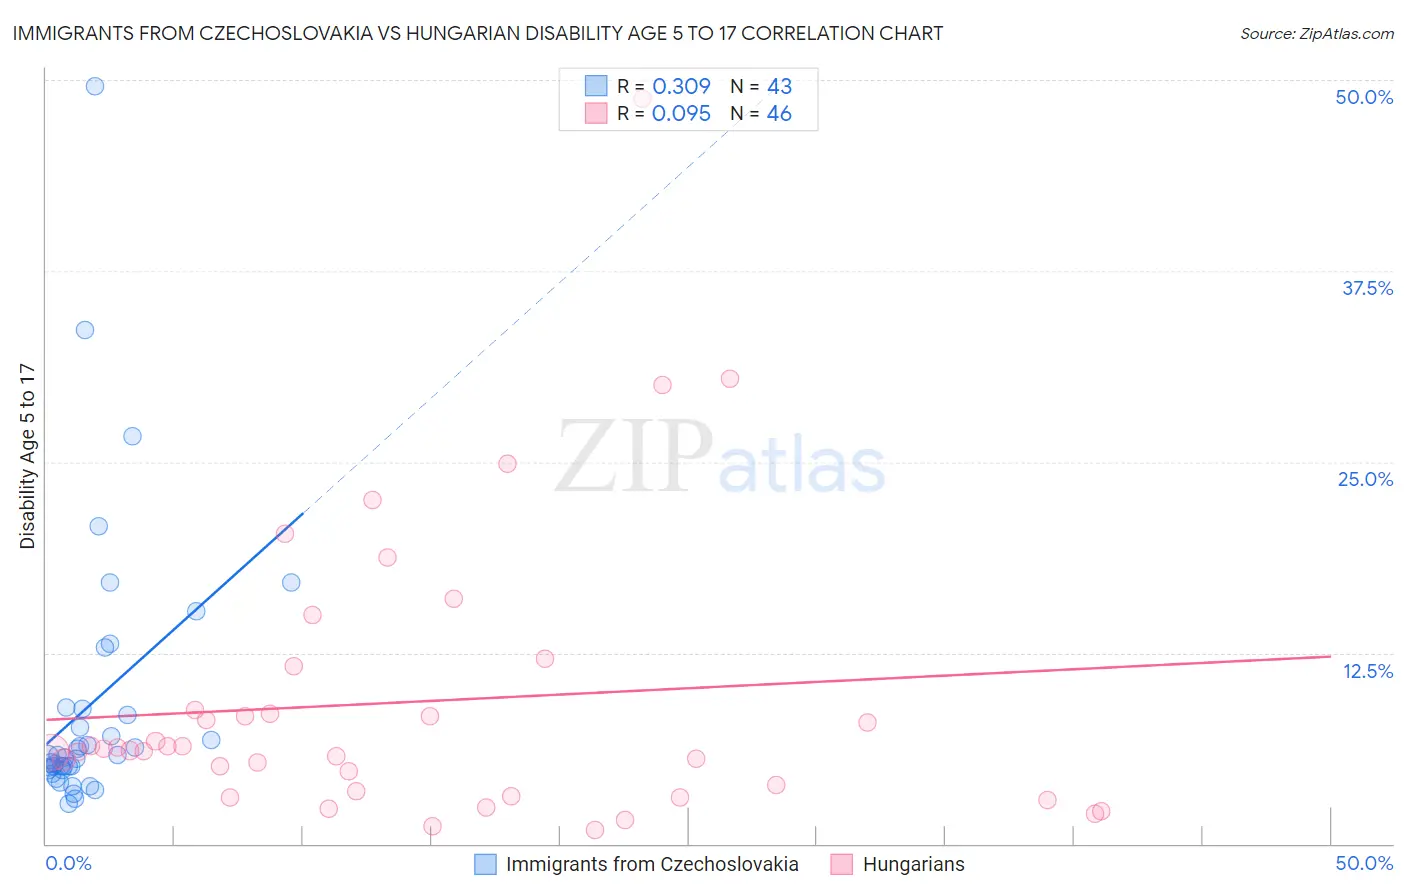
Immigrants from Czechoslovakia vs Hungarian Disability Age 5 to 17 Correlation Chart
The statistical analysis conducted on geographies consisting of 194,293,746 people shows a mild positive correlation between the proportion of Immigrants from Czechoslovakia and percentage of population with a disability between the ages 5 and 17 in the United States with a correlation coefficient (R) of 0.309 and weighted average of 5.2%. Similarly, the statistical analysis conducted on geographies consisting of 479,147,501 people shows a slight positive correlation between the proportion of Hungarians and percentage of population with a disability between the ages 5 and 17 in the United States with a correlation coefficient (R) of 0.095 and weighted average of 5.8%, a difference of 12.5%.
Disability Age 5 to 17 Correlation Summary
| Measurement | Immigrants from Czechoslovakia | Hungarian |
| Minimum | 2.6% | 0.90% |
| Maximum | 49.6% | 48.8% |
| Range | 47.0% | 47.9% |
| Mean | 9.1% | 9.3% |
| Median | 5.7% | 6.2% |
| Interquartile 25% (IQ1) | 4.9% | 3.5% |
| Interquartile 75% (IQ3) | 8.8% | 8.7% |
| Interquartile Range (IQR) | 4.0% | 5.3% |
| Standard Deviation (Sample) | 9.0% | 9.4% |
| Standard Deviation (Population) | 8.9% | 9.3% |
Similar Demographics by Disability Age 5 to 17
Demographics Similar to Immigrants from Czechoslovakia by Disability Age 5 to 17
In terms of disability age 5 to 17, the demographic groups most similar to Immigrants from Czechoslovakia are Immigrants from Vietnam (5.2%, a difference of 0.020%), Jordanian (5.2%, a difference of 0.050%), Immigrants from Romania (5.2%, a difference of 0.070%), Immigrants from Belgium (5.2%, a difference of 0.090%), and Guyanese (5.2%, a difference of 0.13%).
| Demographics | Rating | Rank | Disability Age 5 to 17 |
| Palestinians | 99.8 /100 | #66 | Exceptional 5.2% |
| Macedonians | 99.8 /100 | #67 | Exceptional 5.2% |
| Immigrants | Syria | 99.7 /100 | #68 | Exceptional 5.2% |
| Guyanese | 99.7 /100 | #69 | Exceptional 5.2% |
| Immigrants | Belgium | 99.7 /100 | #70 | Exceptional 5.2% |
| Jordanians | 99.7 /100 | #71 | Exceptional 5.2% |
| Immigrants | Vietnam | 99.7 /100 | #72 | Exceptional 5.2% |
| Immigrants | Czechoslovakia | 99.7 /100 | #73 | Exceptional 5.2% |
| Immigrants | Romania | 99.7 /100 | #74 | Exceptional 5.2% |
| Immigrants | Moldova | 99.6 /100 | #75 | Exceptional 5.2% |
| Immigrants | Guyana | 99.6 /100 | #76 | Exceptional 5.2% |
| Immigrants | Kazakhstan | 99.6 /100 | #77 | Exceptional 5.2% |
| Immigrants | Cuba | 99.6 /100 | #78 | Exceptional 5.2% |
| Afghans | 99.6 /100 | #79 | Exceptional 5.2% |
| Sri Lankans | 99.6 /100 | #80 | Exceptional 5.2% |
Demographics Similar to Hungarians by Disability Age 5 to 17
In terms of disability age 5 to 17, the demographic groups most similar to Hungarians are Sudanese (5.8%, a difference of 0.10%), German Russian (5.9%, a difference of 0.10%), West Indian (5.9%, a difference of 0.12%), Immigrants from Brazil (5.8%, a difference of 0.25%), and Immigrants from Caribbean (5.9%, a difference of 0.26%).
| Demographics | Rating | Rank | Disability Age 5 to 17 |
| Europeans | 4.5 /100 | #231 | Tragic 5.8% |
| Immigrants | Laos | 3.8 /100 | #232 | Tragic 5.8% |
| Immigrants | West Indies | 3.5 /100 | #233 | Tragic 5.8% |
| Immigrants | Kenya | 3.4 /100 | #234 | Tragic 5.8% |
| Malaysians | 3.4 /100 | #235 | Tragic 5.8% |
| Immigrants | Brazil | 3.2 /100 | #236 | Tragic 5.8% |
| Sudanese | 2.9 /100 | #237 | Tragic 5.8% |
| Hungarians | 2.6 /100 | #238 | Tragic 5.8% |
| German Russians | 2.4 /100 | #239 | Tragic 5.9% |
| West Indians | 2.4 /100 | #240 | Tragic 5.9% |
| Immigrants | Caribbean | 2.1 /100 | #241 | Tragic 5.9% |
| Spaniards | 2.0 /100 | #242 | Tragic 5.9% |
| Indonesians | 2.0 /100 | #243 | Tragic 5.9% |
| Immigrants | Germany | 1.9 /100 | #244 | Tragic 5.9% |
| Immigrants | Micronesia | 1.9 /100 | #245 | Tragic 5.9% |