Immigrants from Japan vs Swiss Disability Age 5 to 17
COMPARE
Immigrants from Japan
Swiss
Disability Age 5 to 17
Disability Age 5 to 17 Comparison
Immigrants from Japan
Swiss
4.9%
DISABILITY AGE 5 TO 17
100.0/ 100
METRIC RATING
28th/ 347
METRIC RANK
5.8%
DISABILITY AGE 5 TO 17
5.1/ 100
METRIC RATING
227th/ 347
METRIC RANK
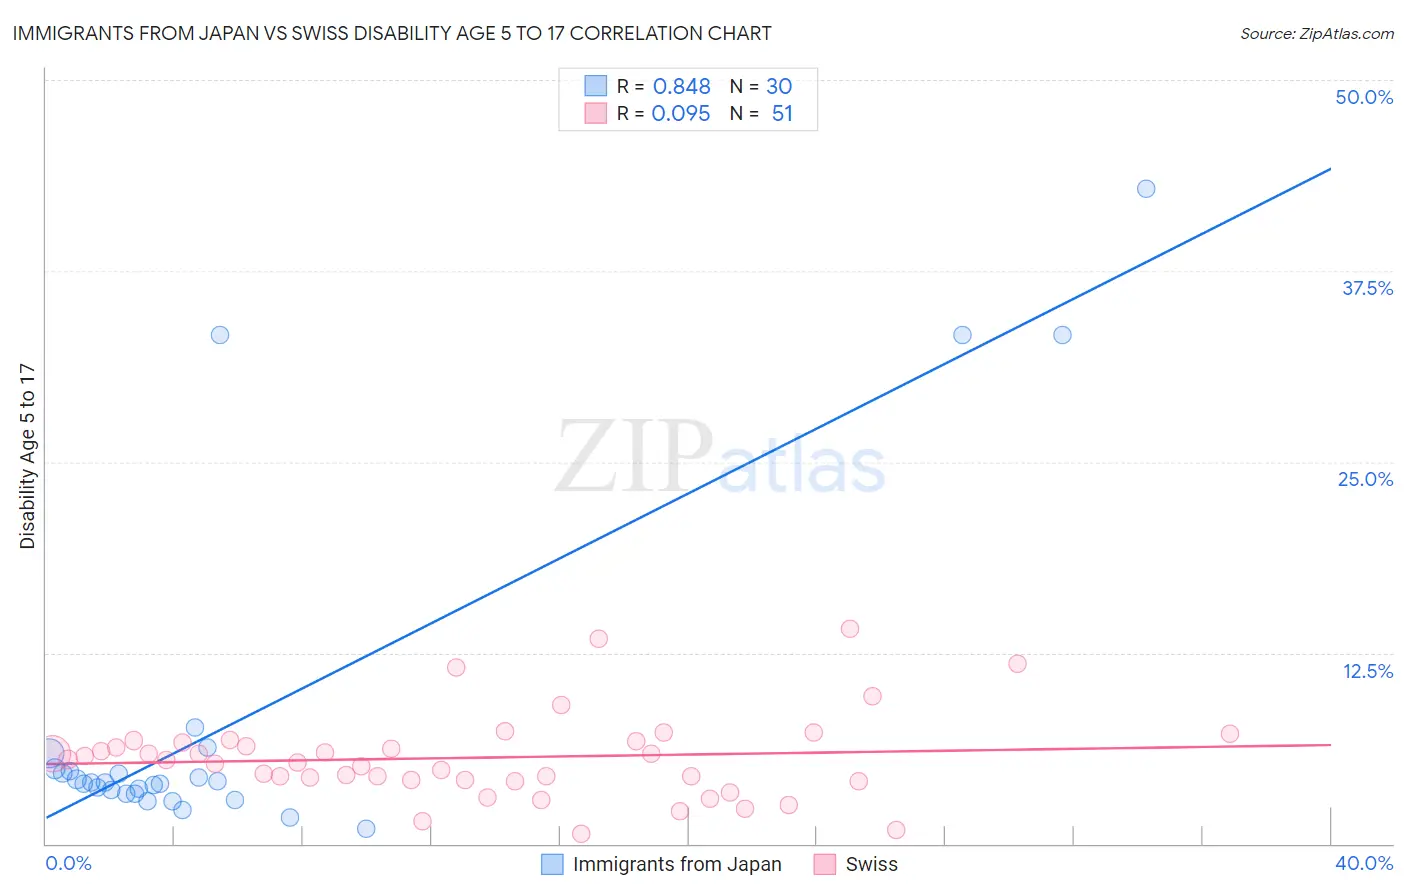
Immigrants from Japan vs Swiss Disability Age 5 to 17 Correlation Chart
The statistical analysis conducted on geographies consisting of 337,854,464 people shows a very strong positive correlation between the proportion of Immigrants from Japan and percentage of population with a disability between the ages 5 and 17 in the United States with a correlation coefficient (R) of 0.848 and weighted average of 4.9%. Similarly, the statistical analysis conducted on geographies consisting of 458,460,312 people shows a slight positive correlation between the proportion of Swiss and percentage of population with a disability between the ages 5 and 17 in the United States with a correlation coefficient (R) of 0.095 and weighted average of 5.8%, a difference of 17.8%.
Disability Age 5 to 17 Correlation Summary
| Measurement | Immigrants from Japan | Swiss |
| Minimum | 0.95% | 0.66% |
| Maximum | 42.9% | 14.1% |
| Range | 41.9% | 13.4% |
| Mean | 8.2% | 5.6% |
| Median | 4.0% | 5.4% |
| Interquartile 25% (IQ1) | 3.3% | 4.2% |
| Interquartile 75% (IQ3) | 4.9% | 6.7% |
| Interquartile Range (IQR) | 1.7% | 2.6% |
| Standard Deviation (Sample) | 11.2% | 2.8% |
| Standard Deviation (Population) | 11.0% | 2.8% |
Similar Demographics by Disability Age 5 to 17
Demographics Similar to Immigrants from Japan by Disability Age 5 to 17
In terms of disability age 5 to 17, the demographic groups most similar to Immigrants from Japan are Taiwanese (4.9%, a difference of 0.080%), Immigrants from Serbia (4.9%, a difference of 0.48%), Bhutanese (4.9%, a difference of 0.64%), Immigrants from Malaysia (5.0%, a difference of 0.70%), and Immigrants from Pakistan (5.0%, a difference of 0.95%).
| Demographics | Rating | Rank | Disability Age 5 to 17 |
| Yup'ik | 100.0 /100 | #21 | Exceptional 4.8% |
| Asians | 100.0 /100 | #22 | Exceptional 4.8% |
| Immigrants | Bolivia | 100.0 /100 | #23 | Exceptional 4.8% |
| Immigrants | Lebanon | 100.0 /100 | #24 | Exceptional 4.8% |
| Immigrants | Asia | 100.0 /100 | #25 | Exceptional 4.8% |
| Bhutanese | 100.0 /100 | #26 | Exceptional 4.9% |
| Taiwanese | 100.0 /100 | #27 | Exceptional 4.9% |
| Immigrants | Japan | 100.0 /100 | #28 | Exceptional 4.9% |
| Immigrants | Serbia | 100.0 /100 | #29 | Exceptional 4.9% |
| Immigrants | Malaysia | 100.0 /100 | #30 | Exceptional 5.0% |
| Immigrants | Pakistan | 100.0 /100 | #31 | Exceptional 5.0% |
| Soviet Union | 100.0 /100 | #32 | Exceptional 5.0% |
| Immigrants | Indonesia | 100.0 /100 | #33 | Exceptional 5.0% |
| Israelis | 100.0 /100 | #34 | Exceptional 5.0% |
| Bolivians | 100.0 /100 | #35 | Exceptional 5.0% |
Demographics Similar to Swiss by Disability Age 5 to 17
In terms of disability age 5 to 17, the demographic groups most similar to Swiss are British West Indian (5.8%, a difference of 0.080%), Haitian (5.8%, a difference of 0.080%), Bangladeshi (5.8%, a difference of 0.090%), Ghanaian (5.8%, a difference of 0.10%), and Guamanian/Chamorro (5.8%, a difference of 0.12%).
| Demographics | Rating | Rank | Disability Age 5 to 17 |
| Belgians | 6.9 /100 | #220 | Tragic 5.8% |
| Lithuanians | 6.7 /100 | #221 | Tragic 5.8% |
| Immigrants | Sudan | 6.7 /100 | #222 | Tragic 5.8% |
| Alsatians | 6.0 /100 | #223 | Tragic 5.8% |
| Mexicans | 5.7 /100 | #224 | Tragic 5.8% |
| Guamanians/Chamorros | 5.6 /100 | #225 | Tragic 5.8% |
| British West Indians | 5.4 /100 | #226 | Tragic 5.8% |
| Swiss | 5.1 /100 | #227 | Tragic 5.8% |
| Haitians | 4.8 /100 | #228 | Tragic 5.8% |
| Bangladeshis | 4.8 /100 | #229 | Tragic 5.8% |
| Ghanaians | 4.7 /100 | #230 | Tragic 5.8% |
| Europeans | 4.5 /100 | #231 | Tragic 5.8% |
| Immigrants | Laos | 3.8 /100 | #232 | Tragic 5.8% |
| Immigrants | West Indies | 3.5 /100 | #233 | Tragic 5.8% |
| Immigrants | Kenya | 3.4 /100 | #234 | Tragic 5.8% |