Immigrants from Croatia vs Choctaw Ambulatory Disability
COMPARE
Immigrants from Croatia
Choctaw
Ambulatory Disability
Ambulatory Disability Comparison
Immigrants from Croatia
Choctaw
6.0%
AMBULATORY DISABILITY
75.1/ 100
METRIC RATING
154th/ 347
METRIC RANK
8.3%
AMBULATORY DISABILITY
0.0/ 100
METRIC RATING
340th/ 347
METRIC RANK
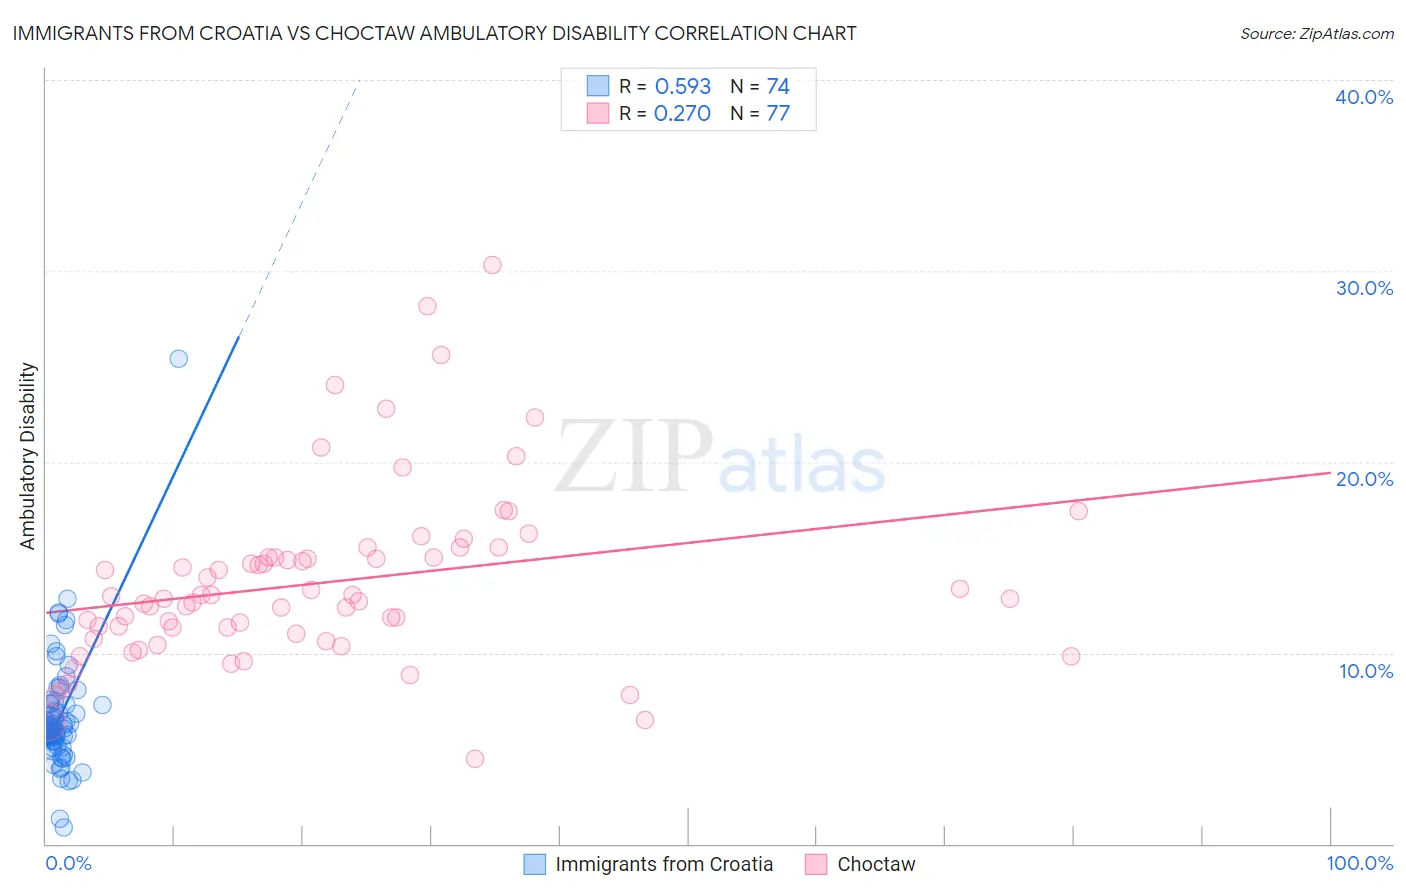
Immigrants from Croatia vs Choctaw Ambulatory Disability Correlation Chart
The statistical analysis conducted on geographies consisting of 132,566,129 people shows a substantial positive correlation between the proportion of Immigrants from Croatia and percentage of population with ambulatory disability in the United States with a correlation coefficient (R) of 0.593 and weighted average of 6.0%. Similarly, the statistical analysis conducted on geographies consisting of 269,636,195 people shows a weak positive correlation between the proportion of Choctaw and percentage of population with ambulatory disability in the United States with a correlation coefficient (R) of 0.270 and weighted average of 8.3%, a difference of 37.9%.
Ambulatory Disability Correlation Summary
| Measurement | Immigrants from Croatia | Choctaw |
| Minimum | 0.85% | 4.5% |
| Maximum | 25.4% | 30.3% |
| Range | 24.5% | 25.8% |
| Mean | 6.7% | 13.7% |
| Median | 6.1% | 12.8% |
| Interquartile 25% (IQ1) | 5.4% | 10.9% |
| Interquartile 75% (IQ3) | 7.3% | 15.0% |
| Interquartile Range (IQR) | 1.9% | 4.1% |
| Standard Deviation (Sample) | 3.2% | 4.7% |
| Standard Deviation (Population) | 3.1% | 4.7% |
Similar Demographics by Ambulatory Disability
Demographics Similar to Immigrants from Croatia by Ambulatory Disability
In terms of ambulatory disability, the demographic groups most similar to Immigrants from Croatia are Syrian (6.0%, a difference of 0.030%), Immigrants from Scotland (6.0%, a difference of 0.21%), Northern European (6.0%, a difference of 0.23%), Ghanaian (6.0%, a difference of 0.26%), and Immigrants from Fiji (6.0%, a difference of 0.27%).
| Demographics | Rating | Rank | Ambulatory Disability |
| Immigrants | Moldova | 82.4 /100 | #147 | Excellent 6.0% |
| Immigrants | Eastern Europe | 82.0 /100 | #148 | Excellent 6.0% |
| Lithuanians | 81.9 /100 | #149 | Excellent 6.0% |
| Maltese | 81.6 /100 | #150 | Excellent 6.0% |
| Greeks | 79.6 /100 | #151 | Good 6.0% |
| Immigrants | Austria | 78.8 /100 | #152 | Good 6.0% |
| Syrians | 75.5 /100 | #153 | Good 6.0% |
| Immigrants | Croatia | 75.1 /100 | #154 | Good 6.0% |
| Immigrants | Scotland | 72.1 /100 | #155 | Good 6.0% |
| Northern Europeans | 71.8 /100 | #156 | Good 6.0% |
| Ghanaians | 71.3 /100 | #157 | Good 6.0% |
| Immigrants | Fiji | 71.2 /100 | #158 | Good 6.0% |
| Immigrants | Latvia | 71.1 /100 | #159 | Good 6.0% |
| Central Americans | 69.8 /100 | #160 | Good 6.0% |
| Immigrants | Belarus | 69.2 /100 | #161 | Good 6.1% |
Demographics Similar to Choctaw by Ambulatory Disability
In terms of ambulatory disability, the demographic groups most similar to Choctaw are Pima (8.2%, a difference of 0.83%), Colville (8.2%, a difference of 1.2%), Creek (8.5%, a difference of 1.6%), Dutch West Indian (8.2%, a difference of 1.8%), and Seminole (8.0%, a difference of 3.4%).
| Demographics | Rating | Rank | Ambulatory Disability |
| Cherokee | 0.0 /100 | #333 | Tragic 7.9% |
| Yuman | 0.0 /100 | #334 | Tragic 7.9% |
| Chickasaw | 0.0 /100 | #335 | Tragic 8.0% |
| Seminole | 0.0 /100 | #336 | Tragic 8.0% |
| Dutch West Indians | 0.0 /100 | #337 | Tragic 8.2% |
| Colville | 0.0 /100 | #338 | Tragic 8.2% |
| Pima | 0.0 /100 | #339 | Tragic 8.2% |
| Choctaw | 0.0 /100 | #340 | Tragic 8.3% |
| Creek | 0.0 /100 | #341 | Tragic 8.5% |
| Kiowa | 0.0 /100 | #342 | Tragic 8.6% |
| Tohono O'odham | 0.0 /100 | #343 | Tragic 8.7% |
| Tsimshian | 0.0 /100 | #344 | Tragic 8.8% |
| Puerto Ricans | 0.0 /100 | #345 | Tragic 8.9% |
| Houma | 0.0 /100 | #346 | Tragic 9.3% |
| Lumbee | 0.0 /100 | #347 | Tragic 9.5% |