Immigrants from Eastern Asia vs Choctaw Ambulatory Disability
COMPARE
Immigrants from Eastern Asia
Choctaw
Ambulatory Disability
Ambulatory Disability Comparison
Immigrants from Eastern Asia
Choctaw
5.3%
AMBULATORY DISABILITY
100.0/ 100
METRIC RATING
14th/ 347
METRIC RANK
8.3%
AMBULATORY DISABILITY
0.0/ 100
METRIC RATING
340th/ 347
METRIC RANK
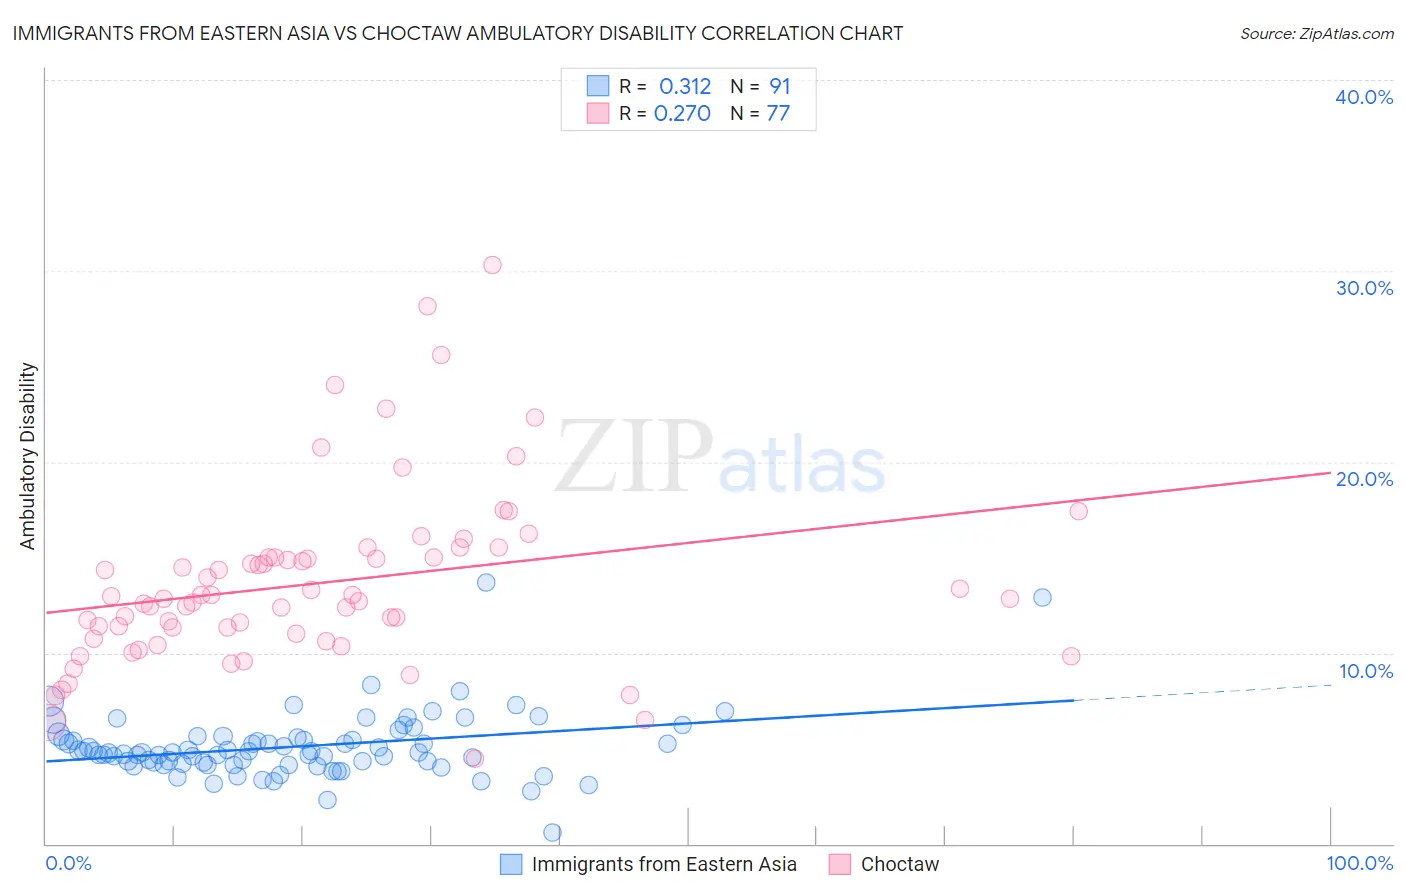
Immigrants from Eastern Asia vs Choctaw Ambulatory Disability Correlation Chart
The statistical analysis conducted on geographies consisting of 499,616,873 people shows a mild positive correlation between the proportion of Immigrants from Eastern Asia and percentage of population with ambulatory disability in the United States with a correlation coefficient (R) of 0.312 and weighted average of 5.3%. Similarly, the statistical analysis conducted on geographies consisting of 269,636,195 people shows a weak positive correlation between the proportion of Choctaw and percentage of population with ambulatory disability in the United States with a correlation coefficient (R) of 0.270 and weighted average of 8.3%, a difference of 57.1%.
Ambulatory Disability Correlation Summary
| Measurement | Immigrants from Eastern Asia | Choctaw |
| Minimum | 0.61% | 4.5% |
| Maximum | 13.7% | 30.3% |
| Range | 13.1% | 25.8% |
| Mean | 5.1% | 13.7% |
| Median | 4.8% | 12.8% |
| Interquartile 25% (IQ1) | 4.2% | 10.9% |
| Interquartile 75% (IQ3) | 5.5% | 15.0% |
| Interquartile Range (IQR) | 1.3% | 4.1% |
| Standard Deviation (Sample) | 1.8% | 4.7% |
| Standard Deviation (Population) | 1.7% | 4.7% |
Similar Demographics by Ambulatory Disability
Demographics Similar to Immigrants from Eastern Asia by Ambulatory Disability
In terms of ambulatory disability, the demographic groups most similar to Immigrants from Eastern Asia are Burmese (5.3%, a difference of 0.15%), Immigrants from China (5.3%, a difference of 0.33%), Okinawan (5.3%, a difference of 0.65%), Immigrants from Hong Kong (5.3%, a difference of 0.87%), and Immigrants from Korea (5.2%, a difference of 0.96%).
| Demographics | Rating | Rank | Ambulatory Disability |
| Bolivians | 100.0 /100 | #7 | Exceptional 5.1% |
| Immigrants | South Central Asia | 100.0 /100 | #8 | Exceptional 5.1% |
| Iranians | 100.0 /100 | #9 | Exceptional 5.1% |
| Yup'ik | 100.0 /100 | #10 | Exceptional 5.2% |
| Immigrants | Korea | 100.0 /100 | #11 | Exceptional 5.2% |
| Okinawans | 100.0 /100 | #12 | Exceptional 5.3% |
| Burmese | 100.0 /100 | #13 | Exceptional 5.3% |
| Immigrants | Eastern Asia | 100.0 /100 | #14 | Exceptional 5.3% |
| Immigrants | China | 100.0 /100 | #15 | Exceptional 5.3% |
| Immigrants | Hong Kong | 100.0 /100 | #16 | Exceptional 5.3% |
| Immigrants | Ethiopia | 100.0 /100 | #17 | Exceptional 5.4% |
| Immigrants | Sri Lanka | 100.0 /100 | #18 | Exceptional 5.4% |
| Indians (Asian) | 100.0 /100 | #19 | Exceptional 5.4% |
| Ethiopians | 100.0 /100 | #20 | Exceptional 5.4% |
| Immigrants | Kuwait | 100.0 /100 | #21 | Exceptional 5.4% |
Demographics Similar to Choctaw by Ambulatory Disability
In terms of ambulatory disability, the demographic groups most similar to Choctaw are Pima (8.2%, a difference of 0.83%), Colville (8.2%, a difference of 1.2%), Creek (8.5%, a difference of 1.6%), Dutch West Indian (8.2%, a difference of 1.8%), and Seminole (8.0%, a difference of 3.4%).
| Demographics | Rating | Rank | Ambulatory Disability |
| Cherokee | 0.0 /100 | #333 | Tragic 7.9% |
| Yuman | 0.0 /100 | #334 | Tragic 7.9% |
| Chickasaw | 0.0 /100 | #335 | Tragic 8.0% |
| Seminole | 0.0 /100 | #336 | Tragic 8.0% |
| Dutch West Indians | 0.0 /100 | #337 | Tragic 8.2% |
| Colville | 0.0 /100 | #338 | Tragic 8.2% |
| Pima | 0.0 /100 | #339 | Tragic 8.2% |
| Choctaw | 0.0 /100 | #340 | Tragic 8.3% |
| Creek | 0.0 /100 | #341 | Tragic 8.5% |
| Kiowa | 0.0 /100 | #342 | Tragic 8.6% |
| Tohono O'odham | 0.0 /100 | #343 | Tragic 8.7% |
| Tsimshian | 0.0 /100 | #344 | Tragic 8.8% |
| Puerto Ricans | 0.0 /100 | #345 | Tragic 8.9% |
| Houma | 0.0 /100 | #346 | Tragic 9.3% |
| Lumbee | 0.0 /100 | #347 | Tragic 9.5% |