Scottish vs Choctaw Ambulatory Disability
COMPARE
Scottish
Choctaw
Ambulatory Disability
Ambulatory Disability Comparison
Scottish
Choctaw
6.5%
AMBULATORY DISABILITY
0.7/ 100
METRIC RATING
253rd/ 347
METRIC RANK
8.3%
AMBULATORY DISABILITY
0.0/ 100
METRIC RATING
340th/ 347
METRIC RANK
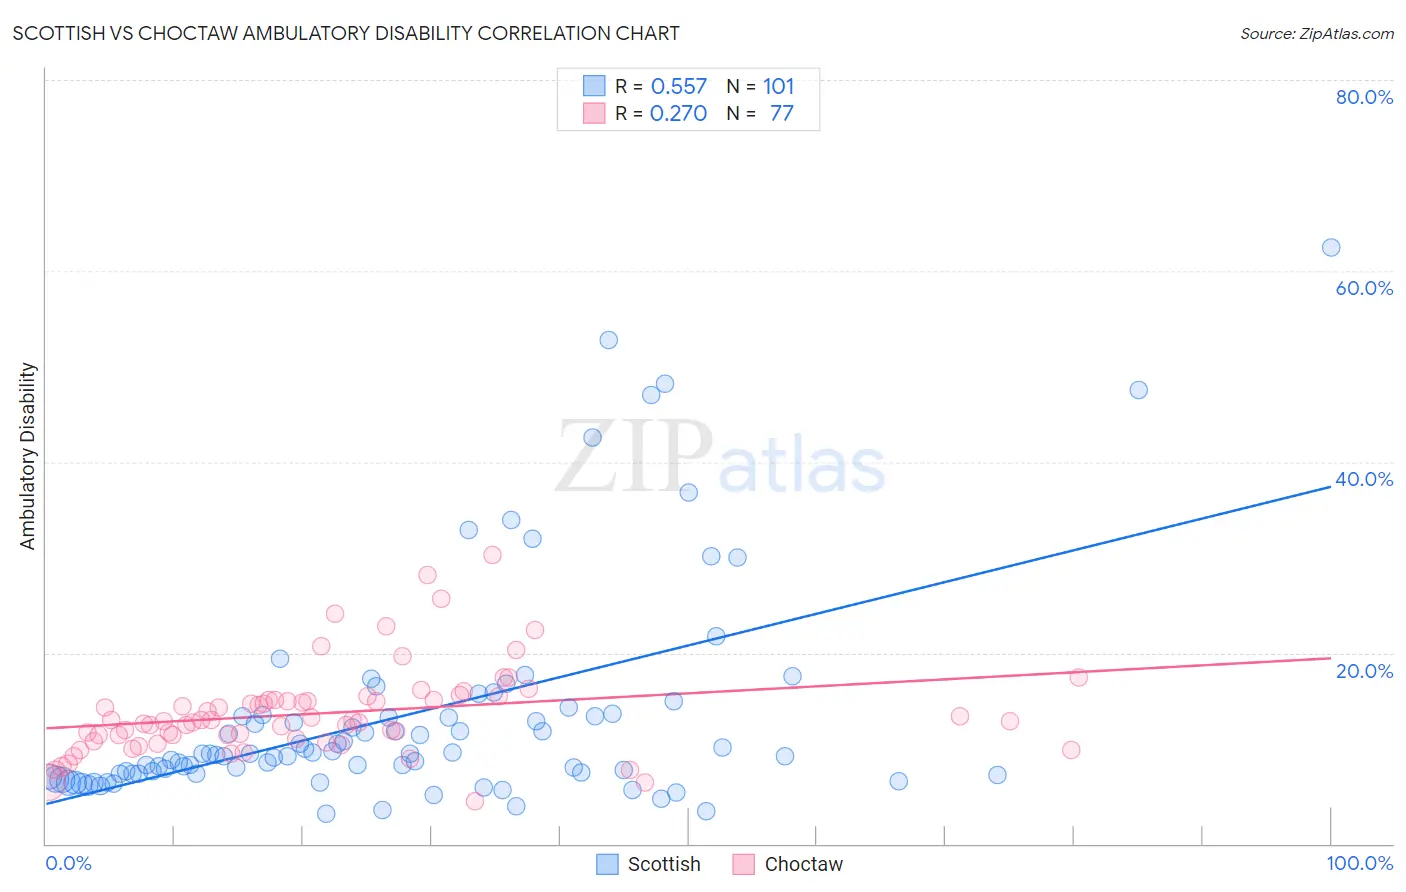
Scottish vs Choctaw Ambulatory Disability Correlation Chart
The statistical analysis conducted on geographies consisting of 566,616,487 people shows a substantial positive correlation between the proportion of Scottish and percentage of population with ambulatory disability in the United States with a correlation coefficient (R) of 0.557 and weighted average of 6.5%. Similarly, the statistical analysis conducted on geographies consisting of 269,636,195 people shows a weak positive correlation between the proportion of Choctaw and percentage of population with ambulatory disability in the United States with a correlation coefficient (R) of 0.270 and weighted average of 8.3%, a difference of 27.6%.
Ambulatory Disability Correlation Summary
| Measurement | Scottish | Choctaw |
| Minimum | 3.1% | 4.5% |
| Maximum | 62.5% | 30.3% |
| Range | 59.4% | 25.8% |
| Mean | 13.4% | 13.7% |
| Median | 9.4% | 12.8% |
| Interquartile 25% (IQ1) | 7.3% | 10.9% |
| Interquartile 75% (IQ3) | 13.4% | 15.0% |
| Interquartile Range (IQR) | 6.1% | 4.1% |
| Standard Deviation (Sample) | 11.4% | 4.7% |
| Standard Deviation (Population) | 11.4% | 4.7% |
Similar Demographics by Ambulatory Disability
Demographics Similar to Scottish by Ambulatory Disability
In terms of ambulatory disability, the demographic groups most similar to Scottish are Immigrants from Bahamas (6.5%, a difference of 0.050%), Belizean (6.5%, a difference of 0.16%), Welsh (6.5%, a difference of 0.23%), Hawaiian (6.5%, a difference of 0.25%), and Immigrants from Uzbekistan (6.5%, a difference of 0.30%).
| Demographics | Rating | Rank | Ambulatory Disability |
| Armenians | 1.5 /100 | #246 | Tragic 6.5% |
| Immigrants | Cuba | 1.4 /100 | #247 | Tragic 6.5% |
| Immigrants | Portugal | 1.4 /100 | #248 | Tragic 6.5% |
| Native Hawaiians | 1.1 /100 | #249 | Tragic 6.5% |
| Chinese | 1.0 /100 | #250 | Tragic 6.5% |
| Hawaiians | 0.9 /100 | #251 | Tragic 6.5% |
| Immigrants | Bahamas | 0.8 /100 | #252 | Tragic 6.5% |
| Scottish | 0.7 /100 | #253 | Tragic 6.5% |
| Belizeans | 0.7 /100 | #254 | Tragic 6.5% |
| Welsh | 0.6 /100 | #255 | Tragic 6.5% |
| Immigrants | Uzbekistan | 0.6 /100 | #256 | Tragic 6.5% |
| Bermudans | 0.5 /100 | #257 | Tragic 6.5% |
| Spanish American Indians | 0.5 /100 | #258 | Tragic 6.5% |
| Aleuts | 0.4 /100 | #259 | Tragic 6.6% |
| Immigrants | Belize | 0.4 /100 | #260 | Tragic 6.6% |
Demographics Similar to Choctaw by Ambulatory Disability
In terms of ambulatory disability, the demographic groups most similar to Choctaw are Pima (8.2%, a difference of 0.83%), Colville (8.2%, a difference of 1.2%), Creek (8.5%, a difference of 1.6%), Dutch West Indian (8.2%, a difference of 1.8%), and Seminole (8.0%, a difference of 3.4%).
| Demographics | Rating | Rank | Ambulatory Disability |
| Cherokee | 0.0 /100 | #333 | Tragic 7.9% |
| Yuman | 0.0 /100 | #334 | Tragic 7.9% |
| Chickasaw | 0.0 /100 | #335 | Tragic 8.0% |
| Seminole | 0.0 /100 | #336 | Tragic 8.0% |
| Dutch West Indians | 0.0 /100 | #337 | Tragic 8.2% |
| Colville | 0.0 /100 | #338 | Tragic 8.2% |
| Pima | 0.0 /100 | #339 | Tragic 8.2% |
| Choctaw | 0.0 /100 | #340 | Tragic 8.3% |
| Creek | 0.0 /100 | #341 | Tragic 8.5% |
| Kiowa | 0.0 /100 | #342 | Tragic 8.6% |
| Tohono O'odham | 0.0 /100 | #343 | Tragic 8.7% |
| Tsimshian | 0.0 /100 | #344 | Tragic 8.8% |
| Puerto Ricans | 0.0 /100 | #345 | Tragic 8.9% |
| Houma | 0.0 /100 | #346 | Tragic 9.3% |
| Lumbee | 0.0 /100 | #347 | Tragic 9.5% |