Immigrants from Croatia vs Immigrants from Canada Ambulatory Disability
COMPARE
Immigrants from Croatia
Immigrants from Canada
Ambulatory Disability
Ambulatory Disability Comparison
Immigrants from Croatia
Immigrants from Canada
6.0%
AMBULATORY DISABILITY
75.1/ 100
METRIC RATING
154th/ 347
METRIC RANK
6.1%
AMBULATORY DISABILITY
50.0/ 100
METRIC RATING
174th/ 347
METRIC RANK
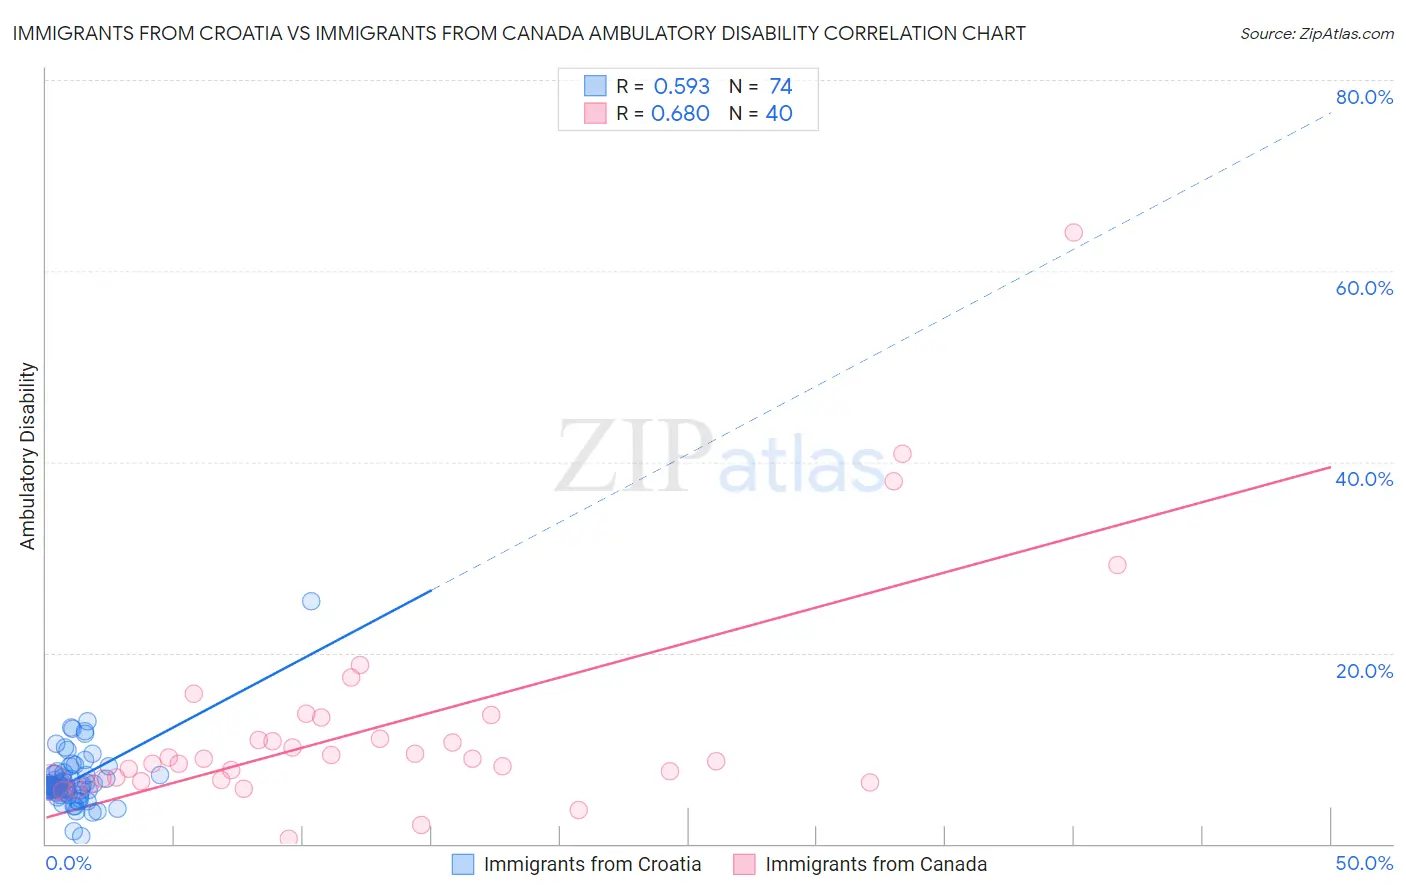
Immigrants from Croatia vs Immigrants from Canada Ambulatory Disability Correlation Chart
The statistical analysis conducted on geographies consisting of 132,566,129 people shows a substantial positive correlation between the proportion of Immigrants from Croatia and percentage of population with ambulatory disability in the United States with a correlation coefficient (R) of 0.593 and weighted average of 6.0%. Similarly, the statistical analysis conducted on geographies consisting of 459,245,879 people shows a significant positive correlation between the proportion of Immigrants from Canada and percentage of population with ambulatory disability in the United States with a correlation coefficient (R) of 0.680 and weighted average of 6.1%, a difference of 1.5%.
Ambulatory Disability Correlation Summary
| Measurement | Immigrants from Croatia | Immigrants from Canada |
| Minimum | 0.85% | 0.55% |
| Maximum | 25.4% | 64.0% |
| Range | 24.5% | 63.4% |
| Mean | 6.7% | 12.2% |
| Median | 6.1% | 8.8% |
| Interquartile 25% (IQ1) | 5.4% | 6.6% |
| Interquartile 75% (IQ3) | 7.3% | 12.1% |
| Interquartile Range (IQR) | 1.9% | 5.5% |
| Standard Deviation (Sample) | 3.2% | 11.8% |
| Standard Deviation (Population) | 3.1% | 11.6% |
Demographics Similar to Immigrants from Croatia and Immigrants from Canada by Ambulatory Disability
In terms of ambulatory disability, the demographic groups most similar to Immigrants from Croatia are Immigrants from Scotland (6.0%, a difference of 0.21%), Northern European (6.0%, a difference of 0.23%), Ghanaian (6.0%, a difference of 0.26%), Immigrants from Fiji (6.0%, a difference of 0.27%), and Immigrants from Latvia (6.0%, a difference of 0.28%). Similarly, the demographic groups most similar to Immigrants from Canada are Croatian (6.1%, a difference of 0.060%), Immigrants from Burma/Myanmar (6.1%, a difference of 0.11%), Moroccan (6.1%, a difference of 0.14%), Immigrants from Ecuador (6.1%, a difference of 0.20%), and Immigrants from Southern Europe (6.1%, a difference of 0.43%).
| Demographics | Rating | Rank | Ambulatory Disability |
| Immigrants | Croatia | 75.1 /100 | #154 | Good 6.0% |
| Immigrants | Scotland | 72.1 /100 | #155 | Good 6.0% |
| Northern Europeans | 71.8 /100 | #156 | Good 6.0% |
| Ghanaians | 71.3 /100 | #157 | Good 6.0% |
| Immigrants | Fiji | 71.2 /100 | #158 | Good 6.0% |
| Immigrants | Latvia | 71.1 /100 | #159 | Good 6.0% |
| Central Americans | 69.8 /100 | #160 | Good 6.0% |
| Immigrants | Belarus | 69.2 /100 | #161 | Good 6.1% |
| Nigerians | 67.1 /100 | #162 | Good 6.1% |
| Lebanese | 66.2 /100 | #163 | Good 6.1% |
| Basques | 63.7 /100 | #164 | Good 6.1% |
| Nicaraguans | 63.2 /100 | #165 | Good 6.1% |
| Iraqis | 62.8 /100 | #166 | Good 6.1% |
| Immigrants | Oceania | 60.7 /100 | #167 | Good 6.1% |
| Ecuadorians | 60.5 /100 | #168 | Good 6.1% |
| Immigrants | Southern Europe | 58.1 /100 | #169 | Average 6.1% |
| Immigrants | Ecuador | 53.8 /100 | #170 | Average 6.1% |
| Moroccans | 52.6 /100 | #171 | Average 6.1% |
| Immigrants | Burma/Myanmar | 52.2 /100 | #172 | Average 6.1% |
| Croatians | 51.2 /100 | #173 | Average 6.1% |
| Immigrants | Canada | 50.0 /100 | #174 | Average 6.1% |