Cypriot vs Choctaw Ambulatory Disability
COMPARE
Cypriot
Choctaw
Ambulatory Disability
Ambulatory Disability Comparison
Cypriots
Choctaw
5.5%
AMBULATORY DISABILITY
100.0/ 100
METRIC RATING
38th/ 347
METRIC RANK
8.3%
AMBULATORY DISABILITY
0.0/ 100
METRIC RATING
340th/ 347
METRIC RANK
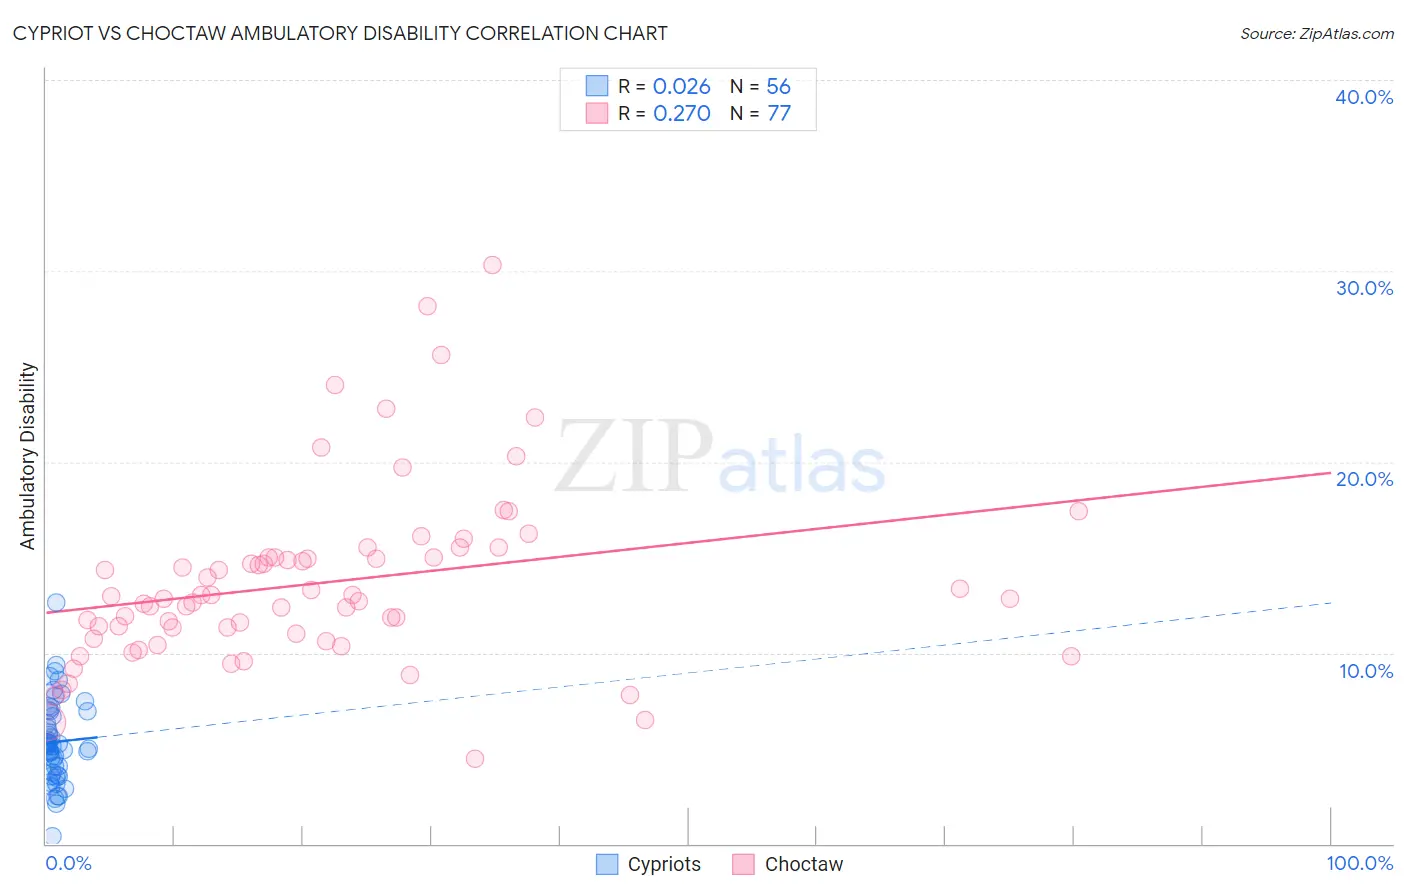
Cypriot vs Choctaw Ambulatory Disability Correlation Chart
The statistical analysis conducted on geographies consisting of 61,870,126 people shows no correlation between the proportion of Cypriots and percentage of population with ambulatory disability in the United States with a correlation coefficient (R) of 0.026 and weighted average of 5.5%. Similarly, the statistical analysis conducted on geographies consisting of 269,636,195 people shows a weak positive correlation between the proportion of Choctaw and percentage of population with ambulatory disability in the United States with a correlation coefficient (R) of 0.270 and weighted average of 8.3%, a difference of 51.7%.
Ambulatory Disability Correlation Summary
| Measurement | Cypriot | Choctaw |
| Minimum | 0.38% | 4.5% |
| Maximum | 12.7% | 30.3% |
| Range | 12.3% | 25.8% |
| Mean | 5.3% | 13.7% |
| Median | 5.1% | 12.8% |
| Interquartile 25% (IQ1) | 3.9% | 10.9% |
| Interquartile 75% (IQ3) | 6.8% | 15.0% |
| Interquartile Range (IQR) | 2.9% | 4.1% |
| Standard Deviation (Sample) | 2.1% | 4.7% |
| Standard Deviation (Population) | 2.1% | 4.7% |
Similar Demographics by Ambulatory Disability
Demographics Similar to Cypriots by Ambulatory Disability
In terms of ambulatory disability, the demographic groups most similar to Cypriots are Turkish (5.5%, a difference of 0.010%), Immigrants from Malaysia (5.5%, a difference of 0.020%), Afghan (5.5%, a difference of 0.090%), Immigrants from Eritrea (5.5%, a difference of 0.090%), and Immigrants from Asia (5.5%, a difference of 0.13%).
| Demographics | Rating | Rank | Ambulatory Disability |
| Immigrants | Venezuela | 100.0 /100 | #31 | Exceptional 5.4% |
| Immigrants | Australia | 100.0 /100 | #32 | Exceptional 5.5% |
| Immigrants | Pakistan | 100.0 /100 | #33 | Exceptional 5.5% |
| Immigrants | Asia | 100.0 /100 | #34 | Exceptional 5.5% |
| Afghans | 100.0 /100 | #35 | Exceptional 5.5% |
| Immigrants | Malaysia | 100.0 /100 | #36 | Exceptional 5.5% |
| Turks | 100.0 /100 | #37 | Exceptional 5.5% |
| Cypriots | 100.0 /100 | #38 | Exceptional 5.5% |
| Immigrants | Eritrea | 100.0 /100 | #39 | Exceptional 5.5% |
| Venezuelans | 99.9 /100 | #40 | Exceptional 5.5% |
| Mongolians | 99.9 /100 | #41 | Exceptional 5.5% |
| Argentineans | 99.9 /100 | #42 | Exceptional 5.5% |
| Paraguayans | 99.9 /100 | #43 | Exceptional 5.5% |
| Immigrants | Indonesia | 99.9 /100 | #44 | Exceptional 5.5% |
| Immigrants | Sweden | 99.9 /100 | #45 | Exceptional 5.6% |
Demographics Similar to Choctaw by Ambulatory Disability
In terms of ambulatory disability, the demographic groups most similar to Choctaw are Pima (8.2%, a difference of 0.83%), Colville (8.2%, a difference of 1.2%), Creek (8.5%, a difference of 1.6%), Dutch West Indian (8.2%, a difference of 1.8%), and Seminole (8.0%, a difference of 3.4%).
| Demographics | Rating | Rank | Ambulatory Disability |
| Cherokee | 0.0 /100 | #333 | Tragic 7.9% |
| Yuman | 0.0 /100 | #334 | Tragic 7.9% |
| Chickasaw | 0.0 /100 | #335 | Tragic 8.0% |
| Seminole | 0.0 /100 | #336 | Tragic 8.0% |
| Dutch West Indians | 0.0 /100 | #337 | Tragic 8.2% |
| Colville | 0.0 /100 | #338 | Tragic 8.2% |
| Pima | 0.0 /100 | #339 | Tragic 8.2% |
| Choctaw | 0.0 /100 | #340 | Tragic 8.3% |
| Creek | 0.0 /100 | #341 | Tragic 8.5% |
| Kiowa | 0.0 /100 | #342 | Tragic 8.6% |
| Tohono O'odham | 0.0 /100 | #343 | Tragic 8.7% |
| Tsimshian | 0.0 /100 | #344 | Tragic 8.8% |
| Puerto Ricans | 0.0 /100 | #345 | Tragic 8.9% |
| Houma | 0.0 /100 | #346 | Tragic 9.3% |
| Lumbee | 0.0 /100 | #347 | Tragic 9.5% |