Immigrants from South Africa vs Choctaw Ambulatory Disability
COMPARE
Immigrants from South Africa
Choctaw
Ambulatory Disability
Ambulatory Disability Comparison
Immigrants from South Africa
Choctaw
5.7%
AMBULATORY DISABILITY
99.3/ 100
METRIC RATING
75th/ 347
METRIC RANK
8.3%
AMBULATORY DISABILITY
0.0/ 100
METRIC RATING
340th/ 347
METRIC RANK
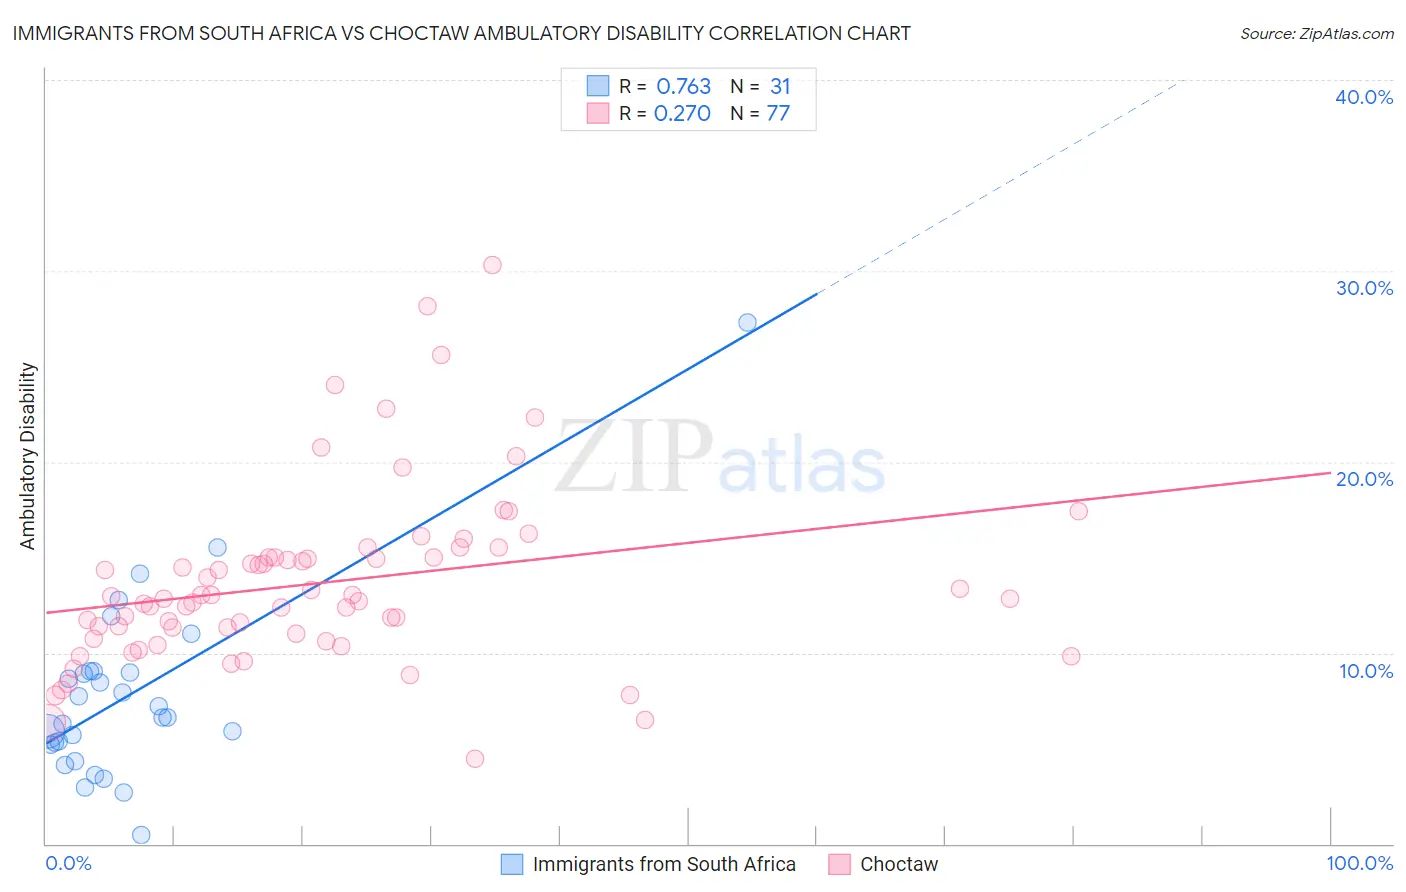
Immigrants from South Africa vs Choctaw Ambulatory Disability Correlation Chart
The statistical analysis conducted on geographies consisting of 233,268,950 people shows a strong positive correlation between the proportion of Immigrants from South Africa and percentage of population with ambulatory disability in the United States with a correlation coefficient (R) of 0.763 and weighted average of 5.7%. Similarly, the statistical analysis conducted on geographies consisting of 269,636,195 people shows a weak positive correlation between the proportion of Choctaw and percentage of population with ambulatory disability in the United States with a correlation coefficient (R) of 0.270 and weighted average of 8.3%, a difference of 45.6%.
Ambulatory Disability Correlation Summary
| Measurement | Immigrants from South Africa | Choctaw |
| Minimum | 0.47% | 4.5% |
| Maximum | 27.3% | 30.3% |
| Range | 26.8% | 25.8% |
| Mean | 7.8% | 13.7% |
| Median | 6.6% | 12.8% |
| Interquartile 25% (IQ1) | 5.2% | 10.9% |
| Interquartile 75% (IQ3) | 9.0% | 15.0% |
| Interquartile Range (IQR) | 3.8% | 4.1% |
| Standard Deviation (Sample) | 5.0% | 4.7% |
| Standard Deviation (Population) | 4.9% | 4.7% |
Similar Demographics by Ambulatory Disability
Demographics Similar to Immigrants from South Africa by Ambulatory Disability
In terms of ambulatory disability, the demographic groups most similar to Immigrants from South Africa are Sudanese (5.7%, a difference of 0.020%), Immigrants from Cameroon (5.7%, a difference of 0.050%), Immigrants from Northern Africa (5.7%, a difference of 0.060%), Brazilian (5.7%, a difference of 0.070%), and Immigrants from Peru (5.7%, a difference of 0.090%).
| Demographics | Rating | Rank | Ambulatory Disability |
| Sri Lankans | 99.6 /100 | #68 | Exceptional 5.7% |
| Peruvians | 99.5 /100 | #69 | Exceptional 5.7% |
| Sierra Leoneans | 99.4 /100 | #70 | Exceptional 5.7% |
| Immigrants | Peru | 99.4 /100 | #71 | Exceptional 5.7% |
| Brazilians | 99.4 /100 | #72 | Exceptional 5.7% |
| Immigrants | Northern Africa | 99.4 /100 | #73 | Exceptional 5.7% |
| Immigrants | Cameroon | 99.4 /100 | #74 | Exceptional 5.7% |
| Immigrants | South Africa | 99.3 /100 | #75 | Exceptional 5.7% |
| Sudanese | 99.3 /100 | #76 | Exceptional 5.7% |
| Immigrants | Vietnam | 99.3 /100 | #77 | Exceptional 5.7% |
| Somalis | 99.2 /100 | #78 | Exceptional 5.7% |
| Chileans | 99.2 /100 | #79 | Exceptional 5.7% |
| Immigrants | Ireland | 99.2 /100 | #80 | Exceptional 5.7% |
| Immigrants | Jordan | 99.2 /100 | #81 | Exceptional 5.7% |
| Palestinians | 99.2 /100 | #82 | Exceptional 5.7% |
Demographics Similar to Choctaw by Ambulatory Disability
In terms of ambulatory disability, the demographic groups most similar to Choctaw are Pima (8.2%, a difference of 0.83%), Colville (8.2%, a difference of 1.2%), Creek (8.5%, a difference of 1.6%), Dutch West Indian (8.2%, a difference of 1.8%), and Seminole (8.0%, a difference of 3.4%).
| Demographics | Rating | Rank | Ambulatory Disability |
| Cherokee | 0.0 /100 | #333 | Tragic 7.9% |
| Yuman | 0.0 /100 | #334 | Tragic 7.9% |
| Chickasaw | 0.0 /100 | #335 | Tragic 8.0% |
| Seminole | 0.0 /100 | #336 | Tragic 8.0% |
| Dutch West Indians | 0.0 /100 | #337 | Tragic 8.2% |
| Colville | 0.0 /100 | #338 | Tragic 8.2% |
| Pima | 0.0 /100 | #339 | Tragic 8.2% |
| Choctaw | 0.0 /100 | #340 | Tragic 8.3% |
| Creek | 0.0 /100 | #341 | Tragic 8.5% |
| Kiowa | 0.0 /100 | #342 | Tragic 8.6% |
| Tohono O'odham | 0.0 /100 | #343 | Tragic 8.7% |
| Tsimshian | 0.0 /100 | #344 | Tragic 8.8% |
| Puerto Ricans | 0.0 /100 | #345 | Tragic 8.9% |
| Houma | 0.0 /100 | #346 | Tragic 9.3% |
| Lumbee | 0.0 /100 | #347 | Tragic 9.5% |