Immigrants from Congo vs Puerto Rican Ambulatory Disability
COMPARE
Immigrants from Congo
Puerto Rican
Ambulatory Disability
Ambulatory Disability Comparison
Immigrants from Congo
Puerto Ricans
6.2%
AMBULATORY DISABILITY
18.2/ 100
METRIC RATING
204th/ 347
METRIC RANK
8.9%
AMBULATORY DISABILITY
0.0/ 100
METRIC RATING
345th/ 347
METRIC RANK
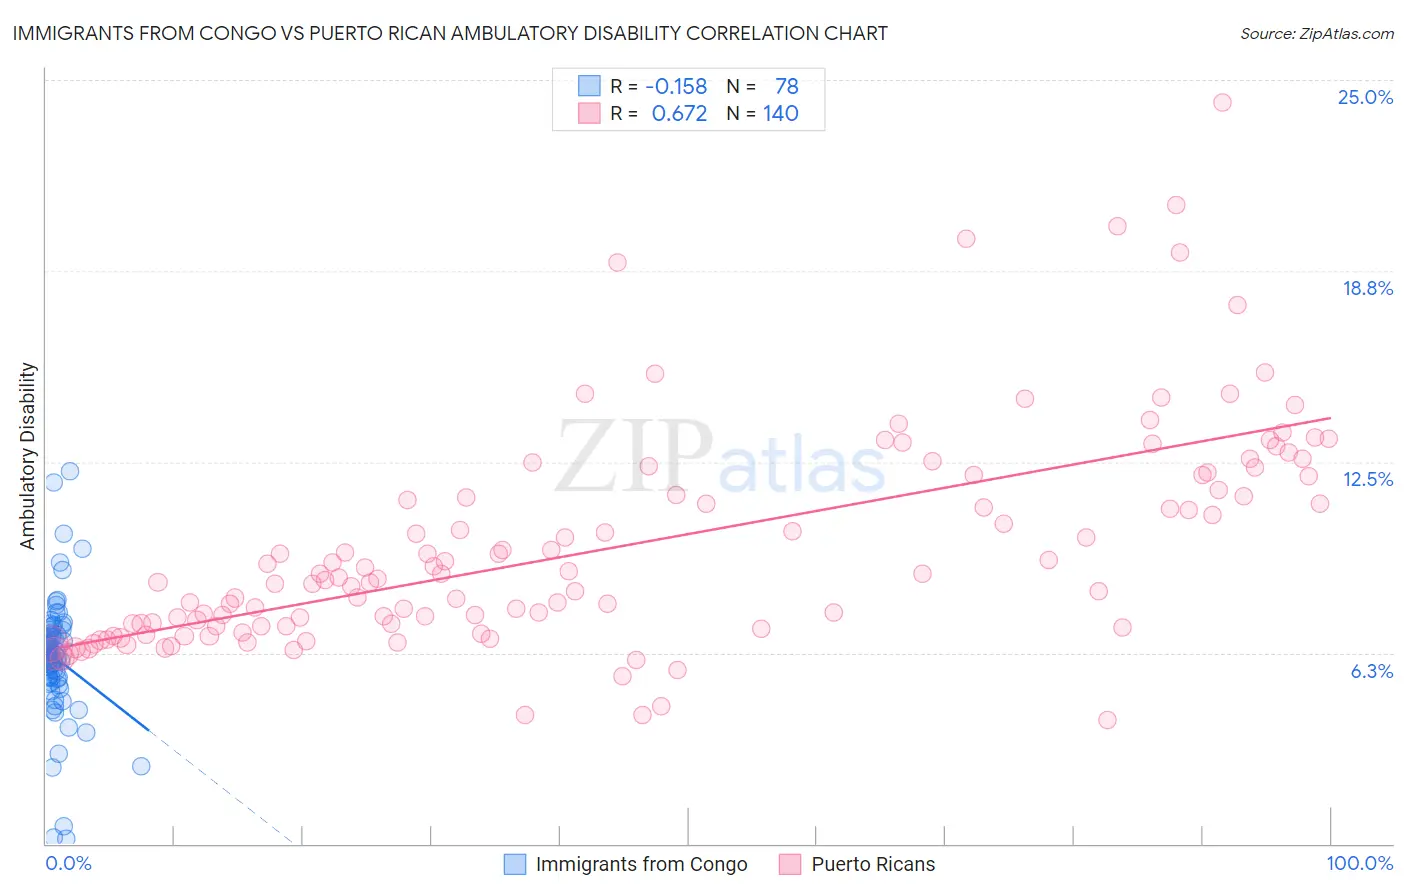
Immigrants from Congo vs Puerto Rican Ambulatory Disability Correlation Chart
The statistical analysis conducted on geographies consisting of 92,115,389 people shows a poor negative correlation between the proportion of Immigrants from Congo and percentage of population with ambulatory disability in the United States with a correlation coefficient (R) of -0.158 and weighted average of 6.2%. Similarly, the statistical analysis conducted on geographies consisting of 527,889,782 people shows a significant positive correlation between the proportion of Puerto Ricans and percentage of population with ambulatory disability in the United States with a correlation coefficient (R) of 0.672 and weighted average of 8.9%, a difference of 42.2%.
Ambulatory Disability Correlation Summary
| Measurement | Immigrants from Congo | Puerto Rican |
| Minimum | 0.17% | 4.0% |
| Maximum | 12.2% | 24.3% |
| Range | 12.0% | 20.2% |
| Mean | 6.1% | 9.7% |
| Median | 6.1% | 8.7% |
| Interquartile 25% (IQ1) | 5.4% | 7.1% |
| Interquartile 75% (IQ3) | 6.9% | 11.8% |
| Interquartile Range (IQR) | 1.5% | 4.7% |
| Standard Deviation (Sample) | 2.0% | 3.6% |
| Standard Deviation (Population) | 2.0% | 3.6% |
Similar Demographics by Ambulatory Disability
Demographics Similar to Immigrants from Congo by Ambulatory Disability
In terms of ambulatory disability, the demographic groups most similar to Immigrants from Congo are Immigrants from Ukraine (6.2%, a difference of 0.010%), Slovene (6.2%, a difference of 0.020%), Finnish (6.2%, a difference of 0.090%), Albanian (6.2%, a difference of 0.13%), and Immigrants from Central America (6.2%, a difference of 0.15%).
| Demographics | Rating | Rank | Ambulatory Disability |
| Poles | 26.3 /100 | #197 | Fair 6.2% |
| Immigrants | Bangladesh | 24.6 /100 | #198 | Fair 6.2% |
| Italians | 22.6 /100 | #199 | Fair 6.2% |
| Immigrants | Cambodia | 21.5 /100 | #200 | Fair 6.2% |
| Immigrants | Central America | 20.1 /100 | #201 | Fair 6.2% |
| Albanians | 19.7 /100 | #202 | Poor 6.2% |
| Immigrants | Ukraine | 18.4 /100 | #203 | Poor 6.2% |
| Immigrants | Congo | 18.2 /100 | #204 | Poor 6.2% |
| Slovenes | 18.0 /100 | #205 | Poor 6.2% |
| Finns | 17.2 /100 | #206 | Poor 6.2% |
| Alsatians | 15.1 /100 | #207 | Poor 6.3% |
| Bangladeshis | 14.2 /100 | #208 | Poor 6.3% |
| Immigrants | Iraq | 14.0 /100 | #209 | Poor 6.3% |
| Immigrants | Laos | 13.2 /100 | #210 | Poor 6.3% |
| Samoans | 12.1 /100 | #211 | Poor 6.3% |
Demographics Similar to Puerto Ricans by Ambulatory Disability
In terms of ambulatory disability, the demographic groups most similar to Puerto Ricans are Tsimshian (8.8%, a difference of 0.59%), Tohono O'odham (8.7%, a difference of 1.6%), Kiowa (8.6%, a difference of 3.1%), Houma (9.3%, a difference of 4.9%), and Creek (8.5%, a difference of 5.0%).
| Demographics | Rating | Rank | Ambulatory Disability |
| Cherokee | 0.0 /100 | #333 | Tragic 7.9% |
| Yuman | 0.0 /100 | #334 | Tragic 7.9% |
| Chickasaw | 0.0 /100 | #335 | Tragic 8.0% |
| Seminole | 0.0 /100 | #336 | Tragic 8.0% |
| Dutch West Indians | 0.0 /100 | #337 | Tragic 8.2% |
| Colville | 0.0 /100 | #338 | Tragic 8.2% |
| Pima | 0.0 /100 | #339 | Tragic 8.2% |
| Choctaw | 0.0 /100 | #340 | Tragic 8.3% |
| Creek | 0.0 /100 | #341 | Tragic 8.5% |
| Kiowa | 0.0 /100 | #342 | Tragic 8.6% |
| Tohono O'odham | 0.0 /100 | #343 | Tragic 8.7% |
| Tsimshian | 0.0 /100 | #344 | Tragic 8.8% |
| Puerto Ricans | 0.0 /100 | #345 | Tragic 8.9% |
| Houma | 0.0 /100 | #346 | Tragic 9.3% |
| Lumbee | 0.0 /100 | #347 | Tragic 9.5% |